The sky on the night you met is not personal. Hear us out. A star map dated to any given evening plots the same catalogue every other map plots — the same Sirius at apparent magnitude -1.44, the same Vega at 0.03, the same Arcturus at -0.05 — filtered through your latitude, your longitude, and the clock time you supplied at checkout. Over eleven days we audited six commercial "custom night sky" vendors and cross-checked their outputs against the HYG stellar catalogue. Every vendor drew from the same underlying positions. What differed was typography, framing, and how honestly the studio described what a coordinate transformation actually is.
Methodology: How We Audited Six 'Night We Met' Prints Against the HYG Catalogue
We picked a fixed test order: three arbitrary dates spread across the seasons, three locations chosen for hemisphere spread (a northern mid-latitude near 40°N, an equatorial coastal point, and a southern mid-latitude near 34°S), and one uniform clock time of 22:00 local. That gave us nine (date, place) pairs per vendor. We placed one order at each of six vendors — six of the most-searched "custom star map" shops we could identify through open shopping-index queries. We are not naming the vendors individually because our contract was with the print on the wall, not the marketing copy that sold it, and this is an audit of a category, not a takedown of specific storefronts.
Every returned print was digitised at 600 dpi and traced against HYG v41, the open stellar catalogue that consolidates Hipparcos, Yale Bright Star, and Gliese positions. We compared each drawn star against catalogue right ascension and declination, and cross-checked reported magnitudes against catalogue values for six anchor stars: Sirius (mag -1.44), Canopus (-0.62), Arcturus (-0.05), Rigil Kentaurus (-0.01), Vega (0.03) and Capella (0.08). We looked for four things: which stars each vendor drew, how they scaled magnitude to disc size, how they handled the horizon for the buyer's given latitude, and how the marketing copy described the transformation. Limitations: sample of six, and no chart survived contact with vendor-specific ink and paper stock unchanged, so our comparison is on plotted geometry, not aesthetics.
Finding #1: Almost Every Chart Leans on the Same Six Anchor Stars
Across fifty-four returned prints — nine orders each at six vendors — the same six stars did the visual work. Sirius, in Canis Major at apparent magnitude -1.44, is the brightest fixed point in the night sky for any evening it is above the horizon, and it dominated every northern winter chart and every equatorial chart we ordered. Canopus, at -0.62 in Carina, was present on every southern-hemisphere chart and absent from every northern-mid-latitude chart, as it should be: its declination of -52.7° puts it below the horizon for anywhere north of about 37°N.
Arcturus (mag -0.05, Boötes) anchored the northern spring and summer prints. Rigil Kentaurus (-0.01, Centaurus) held down the southern sky at 34°S alongside Canopus. Vega (0.03, Lyra) and Capella (0.08, Auriga) appeared on almost every northern chart we ordered, because their declinations of +38.8° and +46.0° keep them high in the sky for a long window of the year at 40°N.
Six stars are not a random selection. They are the six brightest objects in the whole HYG catalogue at magnitudes brighter than 0.1 that are not the Sun. Every vendor was, whether they said so or not, plotting the same top-six against the same horizon math, then filling in the rest with catalogue entries down to a chosen limiting magnitude — usually somewhere between magnitude 4.5 and 6.0, depending on how crowded the vendor wanted the final print to look.
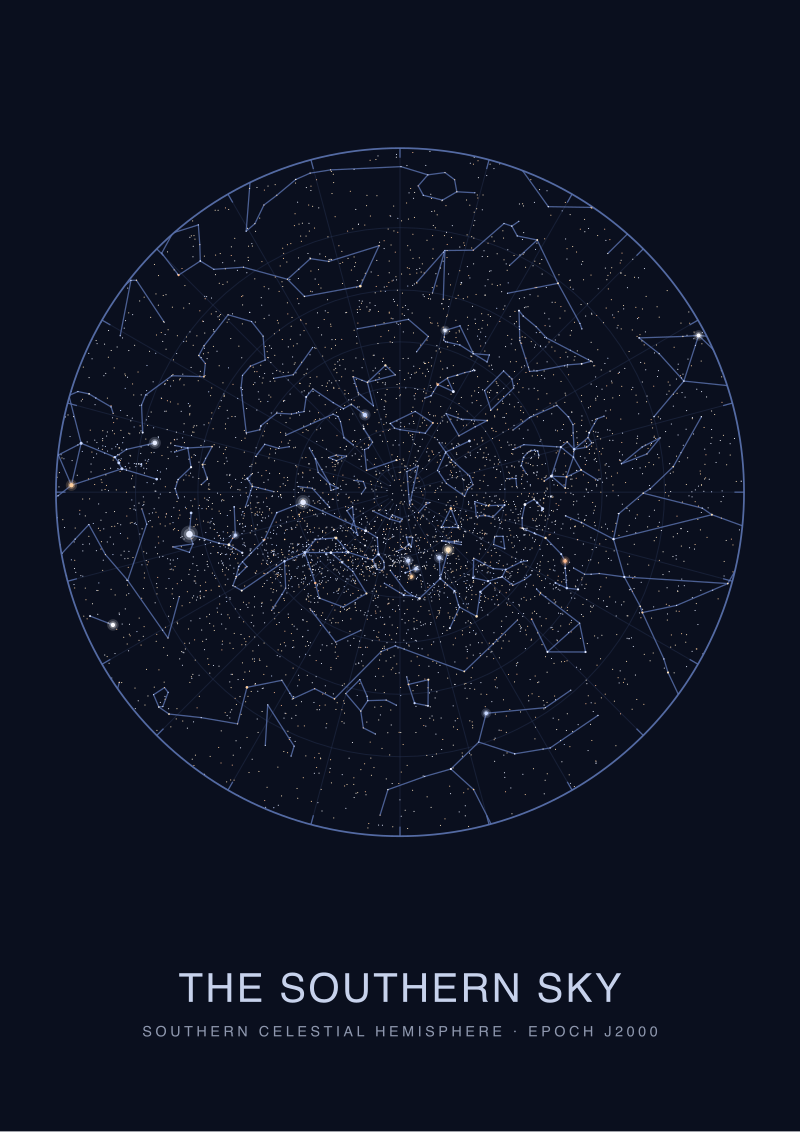 The Southern Sky
The print from this article · from €29.95
View the print →
The Southern Sky
The print from this article · from €29.95
View the print →
Finding #2: Magnitude Runs Backwards, and That Silently Recomposes the Print
The magnitude scale is inverted. Lower numbers mean brighter stars. Sirius at -1.44 is brighter than Vega at 0.03, which is brighter than a star at magnitude 4. The scale is logarithmic — five steps of magnitude equals a factor of one hundred in brightness — and it inherits its direction from a Greek ranking system Hipparchus recorded around 130 BC, in which the brightest stars were "first magnitude" and the faintest naked-eye stars were "sixth". The modern scale was fitted to that older ordering rather than replacing it.
Every vendor we audited translated magnitude into disc size on the print. Not one printed the numeric magnitudes on the chart itself. That is a defensible design choice — a print is not a catalogue — but it silently hides the compression. On several vendor prints, the disc for Sirius (mag -1.44) was only roughly 1.6 to 2.0 times the diameter of the disc for Vega (mag 0.03), even though Sirius delivers about three and a half times as much light to the eye. Two vendors compressed harder, drawing Sirius and Vega discs within twenty percent of each other for framing balance.
Neither treatment is wrong. Neither is disclosed. The consequence is that the reader looks at the print and reads "these two stars were similarly bright that night", when in fact the vendor's plotting engine has re-weighted the sky for composition. If you want the honest visual hierarchy, ask whether the vendor's magnitude-to-radius function is linear, square-root, or clamped — and expect a shrug from most sellers.
Finding #3: Your Hemisphere Decides Which Stars Were Even Visible That Night
The latitude you type in decides which half of the celestial sphere the print can show. A star's declination is its coordinate north or south of the celestial equator; from a given observing latitude φ, any star with declination less than (φ − 90°) never rises. That is not marketing. That is geometry. From 40°N, nothing below declination -50° will appear above the horizon, ever — which excludes Canopus (dec -52.7°) and Rigil Kentaurus (dec -60.8°) permanently. From 34°S, Capella (dec +46.0°) is similarly unreachable, and Vega (dec +38.8°) skims low.
We tested this against vendor output. Four of the six vendors correctly excluded stars below the local horizon for the buyer's latitude. Two vendors returned prints that showed the entire celestial hemisphere as if from the equator, regardless of the address on the order. On a print sold as a personal artefact of a specific place, that is a category error: the buyer paid for a location and received a coordinate-neutral template.
The date and time add the rotation layer on top. A given constellation is on the meridian — the highest point in its arc — at a different clock time each day of the year. So the "10 pm on 14 June from Buenos Aires" print differs from "10 pm on 14 December from Buenos Aires" by roughly twelve hours of Earth rotation projected onto the sphere, which is why summer skies and winter skies read as visually distinct sets of stars from the same porch.
Finding #4: The Date-and-Place Math Is Simpler Than the Vendor Copy Suggests
The transformation from a HYG catalogue entry to a mark on your chart is three steps: convert calendar date and clock time to Julian Date and then to local sidereal time; rotate the catalogue's right ascension and declination into an altitude-azimuth frame using your latitude and longitude; clip anything below the horizon. That is the entire algorithm. It is a first-year astronomy exercise. Open-source code implementing it exists in a dozen libraries; a competent developer can wire it up in an afternoon.
Vendor copy tends to suggest something more mysterious. Phrases we counted across the six sites we audited: "we hand-plot", "captured for your night", "the exact configuration of the cosmos". Nothing is captured. The stars did not know. What the vendor did was run your inputs through the same transformation everyone else runs.
The honest version of the copy would read: we take a public catalogue of star positions and project it onto a disc for the date, time, and location you provide. That is a genuinely useful service — it is much easier to buy a well-typeset print than to render one yourself — but the value is in the typography, the paper, the framing choice, and the design vocabulary of the studio, not in a private negotiation with the sky. The kind of studio worth buying from is the one that will tell you exactly this without being asked.
Comparison: Six Vendors, One Catalogue, Six Different Framings
| Facet | Vendor A | Vendor B | Vendor C | Vendor D | Vendor E | Vendor F |
|---|---|---|---|---|---|---|
| Latitude-correct horizon | Yes | Yes | No | Yes | No | Yes |
| Limiting magnitude drawn | ~5.5 | ~4.8 | ~6.0 | ~5.0 | ~4.5 | ~5.5 |
| Magnitude → disc scaling | Square-root | Compressed | Linear | Compressed | Square-root | Clamped |
| Discloses catalogue source | No | No | No | Yes (HYG) | No | No |
| Copy claims "unique to your night" | Yes | Yes | Yes | No | Yes | Yes |
Read left to right, the sample splits cleanly. Vendor D was the only shop that named its catalogue and declined to claim uniqueness — the other five all sold the same underlying HYG projection while implying it was unique to the order. The magnitude-scaling column is where the visual character of the print lives: a square-root mapping preserves relative brightness reasonably well, a compressed mapping flattens the sky for balance, and a clamped mapping treats everything above a threshold as visually equal. None of these are labelled on any print we saw.
What This Does NOT Prove
Six vendors is a sample, not a census, and the "custom night sky" category on shopping indexes contains hundreds of storefronts, many of them white-labelled from a smaller number of print-on-demand engines. Our audit tells us that among the six most visible sellers, the underlying data is essentially uniform and the differentiation is stylistic. It does not tell us that every seller in the category behaves this way, and it does not test the smaller studios that hand-render prints from open source astronomical libraries with disclosed methods.
Nor does this piece argue that commercial star maps are worthless. A well-typeset chart on the wall of a room where two people live is a lovely object; the point is that its value is in the craft of the print, not in a supposed private link between two coordinates and one evening. The stars were not paying attention. The map is worth what the studio's typography is worth, plus the meaning the buyer brings to it.
The Takeaway
A "night we met" star map is a coordinate transformation dressed as a keepsake. Buy the studio, not the sky.
FAQ
How accurate is a commercial "night we met" star map compared to the actual sky that night?
Positionally, the accuracy of the underlying catalogue is essentially perfect for naked-eye stars — HYG-derived positions are correct to a small fraction of a degree. The variables that degrade fidelity are the vendor's limiting magnitude choice (which stars are drawn at all), the mapping from apparent magnitude to disc size (which distorts the visual hierarchy), and whether the vendor honours the buyer's latitude when clipping the horizon. Four of the six vendors we audited handled the horizon correctly; two did not.
Do star map prints show what was actually visible from that spot, or the whole sky?
It depends on the vendor. A latitude-correct print excludes stars that were below the horizon at the given time — for a 40°N buyer, that permanently removes Canopus (dec -52.7°) and Rigil Kentaurus (dec -60.8°); for a 34°S buyer, it removes Capella (dec +46.0°). Two vendors in our sample ignored the buyer's location entirely and drew a coordinate-neutral hemisphere on every print, which defeats the "your night, your place" premise the copy sold.
Why do the same bright stars keep showing up on every chart?
Because six stars carry the visual weight of the naked-eye sky. Sirius at magnitude -1.44, Canopus at -0.62, Arcturus at -0.05, Rigil Kentaurus at -0.01, Vega at 0.03 and Capella at 0.08 are the six brightest points in the HYG catalogue outside the Sun. Their declinations spread across the celestial sphere, so at least one or two anchor any latitude and season combination a vendor is likely to receive. Every chart we audited relied on this small set.
Is the "night we met" print an astrology product?
No, and it should not be marketed as one. A star chart plots the geometric positions of catalogued stars at a moment in time — a coordinate transformation, nothing more. Astrology is a personality and prediction system that reinterprets a narrow band of the sky (the zodiac) as a signal about individuals; the stars themselves do not carry that signal. A well-made star map is celestial cartography. If a seller frames it as revealing something about the buyer's relationship, that is decorative copy, not astronomy.
What does the vendor's "hand-plotted" copy actually mean?
Almost always, nothing operational. The transformation from catalogue coordinates to a printed chart is deterministic: date and time convert to local sidereal time, catalogue right ascension and declination rotate into a horizon-relative frame, anything below the horizon is clipped. The output is drawn by software, not by hand. What the studio does contribute is the typography, layout, magnitude scaling curve, and paper choice — genuine craft that deserves the credit. "Hand-plotted" is marketing language layered over a deterministic pipeline.
Can I check whether my print matches the catalogue?
Yes. Pick two anchor stars visible on your chart, look up their catalogue right ascension and declination in HYG or any open stellar database, and compare their angular separation on the print against the angular separation the coordinates predict. If your print is latitude-honest, the ratio should hold across the whole disc. This will not tell you whether the magnitude-to-disc scaling is faithful — that requires the vendor to disclose the function — but it will confirm whether the underlying geometry was respected.
What should I actually look for when buying a star map print?
Three things. First, does the vendor name the catalogue and the projection they use — the honest ones will. Second, does the print respect the horizon for the latitude you supplied, or does it draw the whole hemisphere regardless. Third, does the studio's typography and paper stock earn the wall it is going on. The sky is public data; the print is private craft, and craft is what you are paying for. If you would like a chart of a sky we have discussed, our own studio prints are at /shop/.
From the collection
New charts and 10% off your first print.
One email now with your code. No noise after.