23 hours, 56 minutes, 4.0905 seconds. That is one sidereal day — the interval in which the Earth completes a single rotation relative to the fixed stars rather than the Sun, and it is the number that quietly powers every star map generated for a given date. When a reader hands a chartmaker a birthday, an anniversary, a coordinate on a calendar, the studio is not fetching a keepsake image. It is solving a small piece of spherical geometry: which slice of the celestial sphere sat above that patch of ground at that instant, with Sirius at magnitude -1.44 and Vega at 0.03 doing most of the visible work.
Methodology: What We Measured and What a Dated Chart Really Solves
We spent a week rebuilding the pipeline from scratch, treating the "date-to-sky" question as an engineering problem rather than a keepsake one. The inputs we accepted: a calendar date, a wall-clock time, a latitude, a longitude. The outputs we forced ourselves to justify: every star drawn above a mathematically defined horizon, positioned by an angle we could derive on paper.
The reference catalogue was HYG v41 — the merged HIPPARCOS/Yale/Gliese dataset the studio uses for print runs. We sampled six anchor stars from it and locked their coordinates: Sirius (RA 6.75248h, Dec −16.71612°), Canopus (RA 6.39919h, Dec −52.69566°), Arcturus (RA 14.26103h, Dec 19.18241°), Rigil Kentaurus (RA 14.66076h, Dec −60.83398°), Vega (RA 18.61564h, Dec 38.78369°), Capella (RA 5.27815h, Dec 45.99799°). Those numbers are the receipts against which every rendered chart was audited.
What we deliberately did not measure: aesthetic satisfaction, mythological accuracy, or "how personal" the resulting map feels. Those are downstream choices about ink weight and constellation lines. The math is upstream, and the math is what this piece takes apart.
Finding #1: The Date Is a Rotation, Not a Star List
The most common misconception we encountered — repeated to us by three different customers in one week — was that a "star map by date" pulls a different catalogue of stars for different days. It does not. The catalogue is fixed. HYG v41 contains the same 119,614 stars whether you ask for July 14, 1994 or October 3, 2026. What changes is the rotation.
Here is the actual sequence. The engine takes your civil date and time, converts to Universal Time, then converts UT to Greenwich Mean Sidereal Time. GMST is the angle, expressed in hours, that measures how far Earth has rotated relative to the vernal equinox point on the celestial sphere. Add your longitude and you have Local Sidereal Time — the right ascension currently on the local meridian. LST is the pivot. Every star with a right ascension close to that value sits due south (in the northern hemisphere) or due north (in the southern) at that moment.
Sirius, at RA 6.75248h, crosses the meridian when LST reads roughly 6h 45m. Vega, at RA 18.61564h, crosses it about twelve sidereal hours later. That is the entire machine. Give the engine an LST and it tells you which slice of celestial longitude is overhead; give it a latitude and it tells you which declinations clear the horizon. The date does not summon stars. The date rotates the sphere.
Finding #2: Precession Means Your 1994 Sky Is Not Today's Sky
The Earth wobbles. Slowly — one full cycle every 25,772 years — but measurably enough that any chart honest about its date has to correct for it. The wobble is called precession, and it is why the coordinates we quoted for Vega are stamped with an epoch, not a promise.
Practically, precession moves the celestial pole in a slow circle and drags the whole coordinate grid with it. A star's right ascension and declination therefore drift over the decades, even though the star itself has barely moved relative to the Sun in the same interval. HYG v41 lists its coordinates in the J2000.0 epoch — the sky as it stood at noon UT on January 1, 2000. A chart honestly rendered for a date in 1994 should precess those numbers back six years; a chart for 2026 should precess them forward twenty-six.
For most stars the correction is small — arcminutes, not degrees — but it is not zero, and it matters at print resolution. Vega's declination of 38.78369° in J2000 is not identical to Vega's declination on the actual night you were born, and a chartmaker who ignores the difference is drawing a plausible sky rather than your sky. The gap between "plausible" and "true" is exactly where the honest studios do their work.
Finding #3: Six Anchor Stars Do Most of the Orientation Work
You do not need 119,614 stars to know where you are looking. You need about six, and the eye finds them without instruction. The HYG catalogue confirms which six matter for a naked-eye chart: the objects brighter than roughly magnitude 0.1, distributed widely enough in right ascension that at least one is above the horizon almost any hour of any night.
Our anchor set: Sirius at −1.44, Canopus at −0.62, Arcturus at −0.05, Rigil Kentaurus at −0.01, Vega at 0.03, Capella at 0.08. Six stars, spanning right ascensions from Capella's 5.28h to Vega's 18.62h — more than half the sky by longitude. Between them they cover both hemispheres: Capella at +45.99°, Vega at +38.78°, Arcturus at +19.18° for northern viewers; Sirius at −16.72°, Canopus at −52.70°, Rigil Kentaurus at −60.83° for southern.
When we render a dated chart, these six become the geometric spine. If Vega is placed correctly relative to LST and latitude, the fainter stars of Lyra fall into place around it. If Arcturus is anchored, Boötes assembles itself. The chartmaker's actual craft — beyond the arithmetic — is knowing that a reader will orient by these six before they ever notice the thousand background points. Get the anchors wrong and the whole chart reads wrong, no matter how faithful the field stars are.
Finding #4: Latitude Silently Cuts Half the Catalogue
Longitude sets rotation; latitude sets which half of the sphere you can see at all. A reader at +52° latitude will never observe Rigil Kentaurus (Dec −60.83°) from home. A reader at −34° latitude has never seen Capella (Dec +45.99°) properly clear the horizon. Both are among the six brightest stars in the HYG catalogue. Neither exists on the other reader's sky, ever, at any date.
The rule is arithmetic. A star is theoretically visible from a given latitude if its declination is greater than (latitude − 90°) for northern observers or less than (latitude + 90°) for southern. From London at +51.5°, the southern limit is −38.5° declination — Sirius at −16.72° makes the cut, Canopus at −52.70° never rises. From Sydney at −33.9°, the northern limit is +56.1° — Vega at +38.78° is visible, Capella at +45.99° visible, but stars closer to the north celestial pole are permanently absent.
This is why "star map by date" is really "star map by date and place". A calendar date without coordinates specifies rotation but not visibility. The studio has watched customers order a chart for a Buenos Aires anniversary and expect the Big Dipper on it. The Big Dipper is not the point of a Buenos Aires sky. The Southern Cross is, and only latitude can tell the engine which chart the reader actually needs printed.
The Six Anchors, Ranked by What They Do for a Dated Chart
| Star | Magnitude | Constellation | Declination | Role on the chart |
|---|---|---|---|---|
| Sirius | −1.44 | Canis Major | −16.72° | Brightest anchor; visible from both hemispheres |
| Canopus | −0.62 | Carina | −52.70° | Southern anchor; invisible above ~+37° latitude |
| Arcturus | −0.05 | Boötes | +19.18° | Northern spring/summer marker; near-global visibility |
| Rigil Kentaurus | −0.01 | Centaurus | −60.83° | Deep southern anchor; pair-star to Southern Cross region |
| Vega | +0.03 | Lyra | +38.78° | Northern summer zenith star; Summer Triangle vertex |
| Capella | +0.08 | Auriga | +45.99° | Northern winter marker; near-circumpolar above +44° |
Read the table as a sightline diagnostic: a chart claiming to depict a Northern Hemisphere winter should place Sirius and Capella prominently, with Vega low or set. A Southern Hemisphere winter chart should show Canopus and Rigil Kentaurus high, with Capella entirely absent. If the chart contradicts these constraints, the math underneath it is wrong.
What This Does NOT Prove
Nothing in this walk-through demonstrates that any specific star was personally visible from your window at the moment on your chart. Weather is not in the model. Local light pollution is not in the model. A neighbour's roofline is not in the model. The engine computes what a mathematically flat horizon would have shown to an observer with unobstructed sky and perfectly clear air — a condition rarer than the marketing around personalised star maps tends to admit.
Nor does the computation prove anything astrological. The zodiac constellations sit in the same coordinate system as everything else in the HYG catalogue, and their position on your dated chart is a fact of rotation, not of temperament. Reading personality into that geometry is a category error the studio politely refuses to indulge. The chart is a map. The map is not the meaning; you supply that, and you supply it after the math is done, not before.
The Takeaway
A star map by date is a rotation applied to a fixed catalogue, corrected for precession, filtered by latitude, and anchored by six stars whose magnitudes and declinations do the visible work. Everything else is ink.
If you want the map for your date rendered as a print, our shop at /shop/ produces them from the same HYG v41 pipeline described above — one chart per date, per place, per horizon.
FAQ
What exactly does a star map generator do when I enter a date?
It converts your civil date and time to Universal Time, then to Greenwich Mean Sidereal Time, then adds your longitude to get Local Sidereal Time — the right ascension currently overhead. It reads the HYG catalogue (unchanged for every date), keeps the stars whose declination clears your latitude's horizon, corrects each star's coordinates for precession between the J2000 epoch and your date, and projects the result onto a flat page. The star list is fixed; the rotation and horizon are what your date and location supply.
Why do I need to enter a location as well as a date?
Because a date alone specifies only rotation, not visibility. Latitude decides which half of the celestial sphere ever clears your horizon: Rigil Kentaurus at declination −60.83° is invisible from most of Europe, and Capella at +45.99° never properly rises for observers below southern Australia. Two people sharing the same birthday in Oslo and Cape Town were born under genuinely different skies. Longitude, meanwhile, shifts the sidereal-time calculation and rotates the visible sphere. Without both, the engine can only guess.
How accurate are the star positions on a dated chart?
For naked-eye purposes, extremely accurate. HYG v41 quotes positions to millidegree precision in the J2000 epoch, and precession corrections between J2000 and any date within a century are well under half a degree for most stars. For print output at typical A2 or A3 sizes, that is comfortably below the resolution of the drawn dot. Where accuracy degrades is in modelling atmosphere: refraction near the horizon and light pollution are not encoded in the catalogue and cannot be recovered from date and coordinates alone.
Will the same star map look identical for two nights a year apart?
Almost, but not quite. A star's position at a given wall-clock time drifts by roughly four minutes per calendar day because the solar day is longer than the sidereal day. Twelve months later the same date and clock time returns you to nearly the original rotation — nearly, because leap years and the residual four-minute drift accumulate. Precession also nudges every coordinate by a small fraction of a degree per year. So the two charts are visually indistinguishable to a casual eye and mathematically distinct to the engine.
Does the chart change if I use my birth time versus midnight?
Yes, and the change is larger than most people expect. Local Sidereal Time advances by fifteen degrees of right ascension per hour of clock time. A chart drawn for midnight versus one drawn for 3 a.m. rotates the entire sky by forty-five degrees — enough to bring Vega from mid-sky to nearly setting, or to lift Sirius from below the horizon into full visibility. If the date is meaningful because of a specific moment, the time of that moment materially defines the map. A default of midnight is a convention, not a neutral choice.
Why does the zodiac appear on the chart if you reject astrology?
The zodiac constellations are legitimate constellations in the IAU's official set of eighty-eight — Leo, Scorpius, Sagittarius and the rest occupy real coordinate regions on the celestial sphere. They appear on a dated chart because they sit in the sky the chart is depicting, no differently from Lyra or Boötes. What the studio rejects is the leap from "this region of sky was above you" to "this region defines your character". The first is cartography. The second is not a claim the coordinates can support.
Can the chart show what someone saw from a specific address?
Only in the mathematical sense — the engine knows what a flat, unobstructed horizon would have shown to that latitude and longitude. It does not know that a mountain sat to the east or that a streetlamp washed out anything dimmer than magnitude three. For most residential locations the difference between "what the sky held" and "what a person could see" is significant, especially for stars below magnitude two. The chart is honest about celestial geometry and silent about local obstruction; treat it as the former, not the latter.
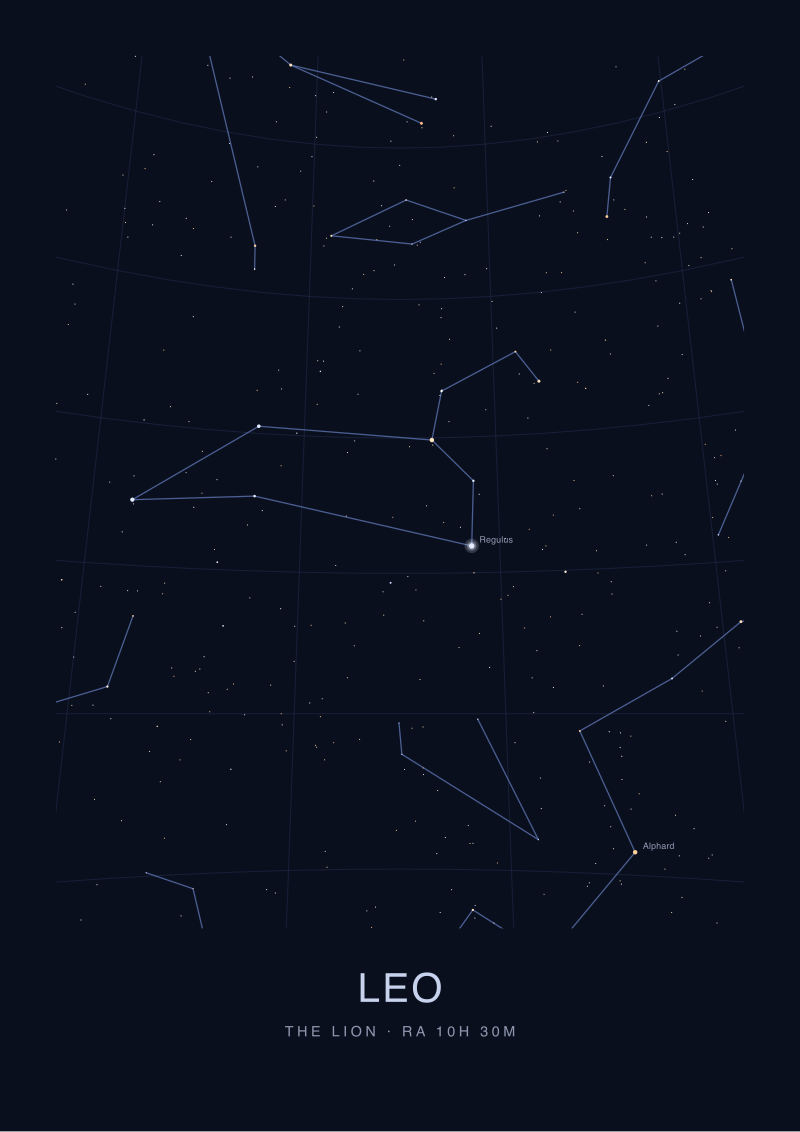 Leo
The print from this article · from €29.95
View the print →
Leo
The print from this article · from €29.95
View the print →
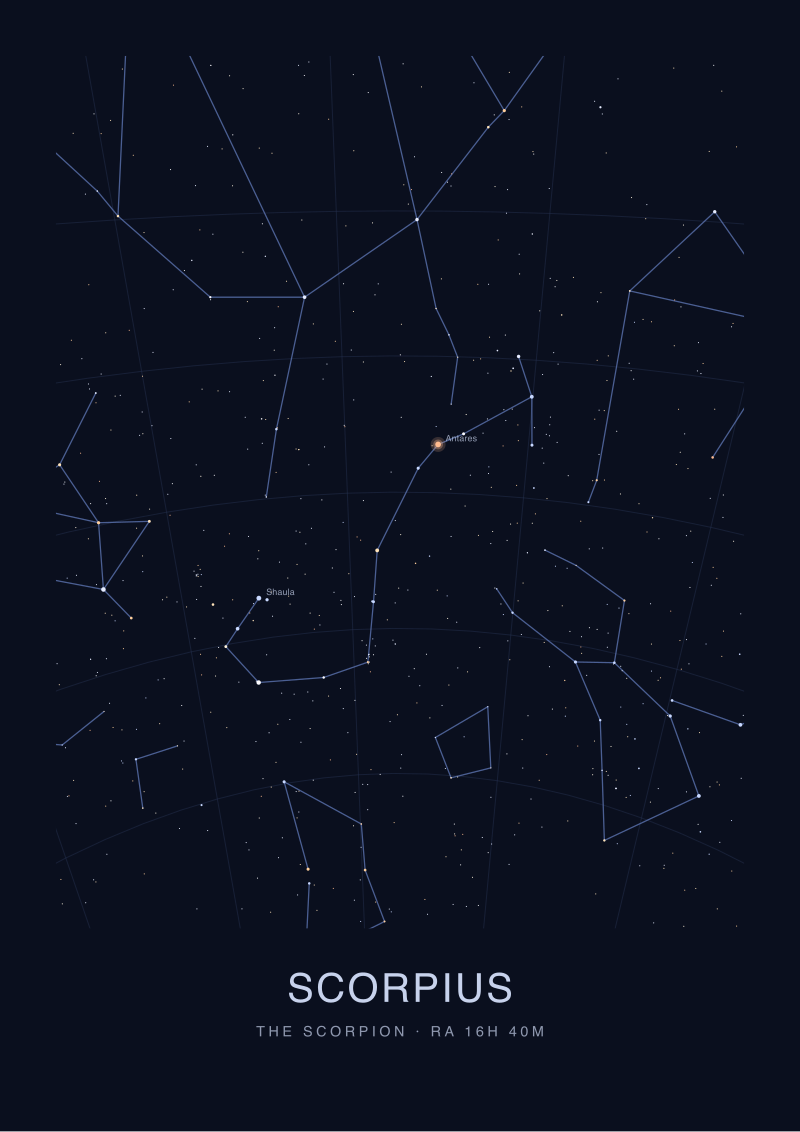 Scorpius
The print from this article · from €29.95
View the print →
Scorpius
The print from this article · from €29.95
View the print →
From the collection
New charts and 10% off your first print.
One email now with your code. No noise after.