Menkent is one star, magnitude 2.06, sitting at right ascension 14.11139 hours and declination −36.36995 degrees in Centaurus. That is the entire grounding record. Ask how its star map is drawn and the honest answer is: it depends on who is drawing it, from where, and for what reader. The dot on the page is trivial. The decisions around the dot — how large to render magnitude 2.06 against the neighbours, whether to draw Centaurus's figure at all, what to do with a southern declination on a northern desk — are the craft. We will walk through three composite scenarios to show what those decisions look like in practice.
Before the first scenario, one clarification. Every choice below is downstream of three numbers: magnitude 2.06, RA 14.11139h, Dec −36.36995°. Those numbers do not change. The map does. If two chartmakers hand you two different Menkent prints, neither is wrong; they answered different questions with the same catalogue row. The scenarios below are composite illustrations, not real commissions. Picture them, do not look for them.
Scenario 1: The Southern Studio Plotting a Single-Star Print
Imagine a studio in Santiago or Cape Town preparing a single-star print centred on Menkent. The reader lives at roughly −33° latitude. Menkent, at declination −36.36995°, passes almost directly overhead once a night. That geographic accident dictates almost every design choice that follows.
The projection is the first decision. For a print centred on a southern star meant to be read by a southern reader, the studio picks a stereographic projection with the tangent point set at RA 14.11139h and Dec −36.36995°. Stereographic is conformal — it preserves angles — which is what you want when the reader will hold the print up against the sky and check that the surrounding stars form the same shapes on paper as they do overhead. The tangent point becomes the geometric centre of the sheet. Menkent lands dead centre, not because it is the brightest thing in frame (it is not necessarily), but because the print is about that star.
Magnitude 2.06 sets the dot size. Studios that plot HYG data typically bin magnitudes in half-magnitude steps and assign a dot diameter to each bin. On a print sized for a wall, a common scaling is roughly 2.2 mm for magnitude 2.0–2.5, tapering to sub-millimetre dots by magnitude 5. Menkent at 2.06 sits at the top of that bin. It reads on paper as a clearly visible star, larger than most of Centaurus's fainter members but not commanding — which is honest, because in the sky it does not command either. A reader glancing up will find Menkent, but only once they know where to look.
The framing radius follows from the reader's field of view. A single-star print typically frames a circle 20 to 30 degrees wide, wide enough to include enough context stars to make the centre recognisable, tight enough that the target does not disappear into a wash of catalogue entries. At 25 degrees around Menkent, the studio pulls in a substantial slice of Centaurus and edges of neighbouring constellations. Every star inside that circle brighter than roughly magnitude 5.5 gets plotted; below that, the paper starts to grey out and the reader loses the pattern.
The last choice is whether to draw the Centaurus figure at all. A southern studio can assume the reader has some fluency with the constellation — the Centaur is a familiar southern figure — and often draws the stick-figure lines lightly, in a low-contrast grey, so the eye can follow them or ignore them. Menkent's role in that figure is anchoring: it sits in the body of the Centaur. Draw the figure and the reader instantly understands why this star, and not another, was worth centring.
Scenario 2: The Northern Cartographer Working from Catalogue Alone
Now picture a cartographer in Berlin or Boston, at roughly +50° latitude, commissioned to include Menkent on a wall-sized general chart of the southern sky. This chartmaker will never see Menkent from their studio window. At +50° latitude, a star at declination −36.37° is either permanently below the horizon or grazes it so low that atmospheric extinction pushes an intrinsic magnitude of 2.06 down toward invisibility. The whole project runs on catalogue data.
That geographic separation changes the register of the chart. The northern desk cannot rely on personal recognition of Centaurus. They cannot glance up to check whether their stick figure feels right. Every plotting decision has to be defensible from the numbers alone. Menkent's coordinates — RA 14.11139h, Dec −36.36995° — are entered exactly as the HYG catalogue reports them, with no local correction, because a wall chart is not an ephemeris and does not need to worry about atmospheric refraction at the reader's specific horizon.
The projection is likely different. For a wall chart of the whole southern sky, the studio picks an equal-area or Lambert azimuthal projection centred on the south celestial pole. Menkent, at −36.37° declination, sits roughly 53.63 degrees from the pole and therefore roughly 53.63 degrees from the centre of the chart, on a radial line drawn at 14.11139h of right ascension — measured as an angle around the pole, converted from hours to degrees by multiplying by 15. That places Menkent well into the outer regions of the chart, in the belt where southern hemisphere stars that never rise for European readers live.
The dot for Menkent is still driven by magnitude 2.06, but the scaling is different on a wall chart than on a single-star print. Wall charts have to accommodate stars down to magnitude 6 or fainter across the entire hemisphere, so the studio compresses the dot-size range. Magnitude 2.06 might get rendered at 1.4 mm on a chart where magnitude 6 is a sub-millimetre pinprick. In relative terms, Menkent stands out; in absolute terms, it is a modest dot.
The northern cartographer also makes a labelling choice a southern studio might skip. On a chart intended for readers who will never see this star, the label "Menkent" appears next to the dot, and the constellation abbreviation "Cen" appears once inside the constellation boundary. The label is a bridge — a reader in Berlin who has learned Centaurus from books uses the label to confirm they have found the right dot on the paper. Southern studios sometimes omit the label because the reader already knows.
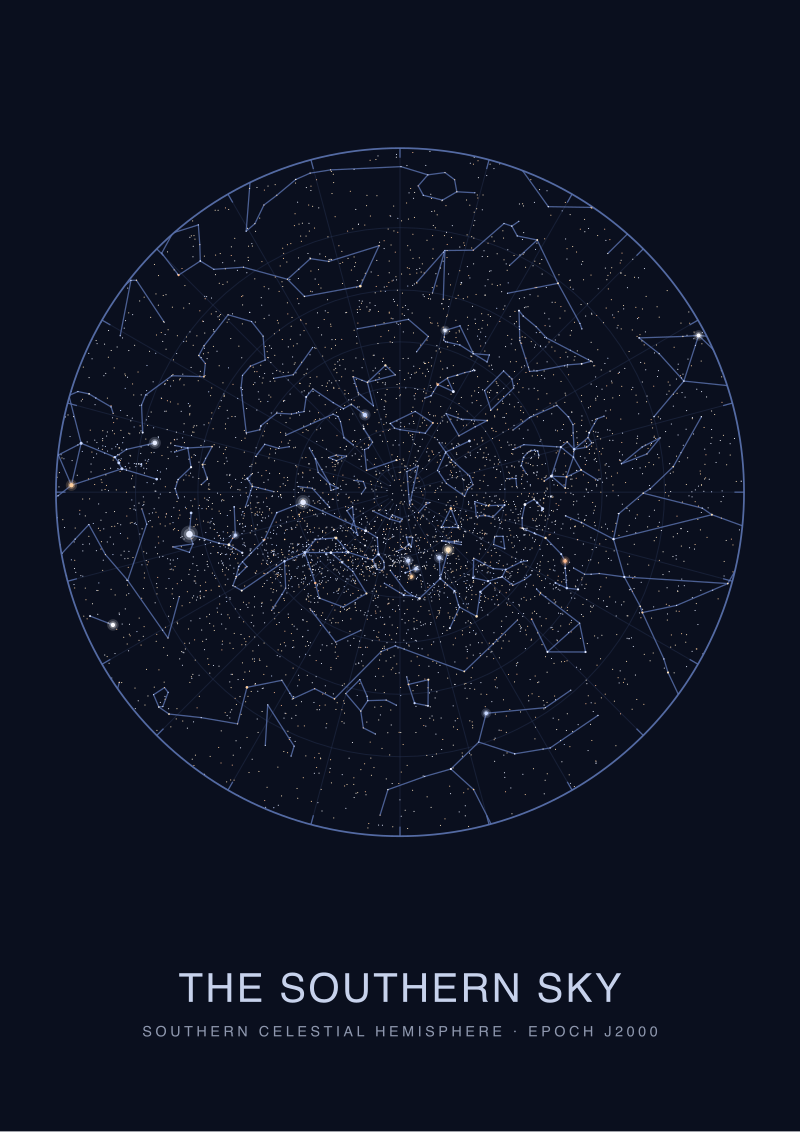 The Southern Sky
The print from this article · from €29.95
View the print →
The Southern Sky
The print from this article · from €29.95
View the print →
Scenario 3: The Teaching Desk Drawing Menkent for a Classroom Chart
Let us say a teaching desk at a planetarium in Melbourne or Buenos Aires needs a chart to introduce Centaurus to a class of students who have never named a star before. The reader is not a chartmaker or a working astronomer. They are learning. That audience rewrites almost every decision the two studios above made.
The projection question softens. A teaching chart does not need conformal preservation of angles; it needs a shape the class can hold in their head. A simple rectangular plot of the region around Centaurus, with RA running left-to-right in hours and Dec running top-to-bottom in degrees, is easier to read than a stereographic circle. Menkent at RA 14.11139h and Dec −36.36995° lands at a specific coordinate on that grid, and the grid itself becomes a teaching tool. Students learn that RA is measured in hours (not degrees) and that declination south of the celestial equator is written as a negative number. Menkent's coordinates are the worked example.
The magnitude decision changes too. A teaching chart cannot afford to render magnitude 2.06 at the same scale it renders magnitude 5. If it did, the whole page would be a scatter of near-identical dots and the class would learn nothing about brightness. So the teaching desk exaggerates. Magnitude 2.06 gets a much larger dot than the linear catalogue mapping would suggest — perhaps 4 mm on a page where magnitude 5 is 0.8 mm. That is dishonest as cartography and correct as pedagogy. The reader has to see that Menkent is brighter than its neighbours before they can be trusted to use a more nuanced chart later.
The Centaurus figure is drawn in full, with heavy lines. A teaching chart cannot afford the low-contrast, take-it-or-leave-it stick figure of the single-star print. Every star that anchors the figure gets its name printed next to it. Menkent's name is one of several the class will meet on this one sheet. Its role in the constellation — sitting in the body of the Centaur — is visually obvious because the figure is drawn to make that role obvious.
One last teaching-desk decision: the chart usually includes the celestial equator as a labelled line and the ecliptic as a second labelled line, with the point where the ecliptic passes the boundary of Centaurus called out. This is where the class learns that Centaurus, despite being a southern constellation, brushes the zodiacal band without being counted as a zodiac sign. Menkent, at −36.37° declination, sits well south of that band. That distance from the ecliptic — visible on the chart as vertical space between Menkent and the ecliptic line — is itself a lesson.
What All Three Share
Three studios, three projections, three dot sizes, three completely different chart objects. What did all three do that was the same?
All three plotted Menkent at exactly RA 14.11139h and Dec −36.36995°. The projection maths transformed those numbers into different (x, y) positions on paper, but the input never varied. Every honest star map is a projection of catalogue coordinates, and every projection is a mathematical function that takes the same input and returns different outputs depending on the projection's parameters. The catalogue is fixed; the map is a choice.
All three used magnitude 2.06 as the driver of the dot's visual weight. The scaling function was different — linear on the single-star print, compressed on the wall chart, exaggerated on the teaching chart — but the input was the same magnitude value from the same HYG catalogue row. A studio that plots dot size from anything other than measured magnitude has stopped drawing a star map and started drawing a decoration.
All three preserved the relationship between Menkent and Centaurus. The single-star print drew the figure lightly, the wall chart used a boundary polygon and a label, the teaching chart drew the full figure with heavy lines. But none of the three severed Menkent from its constellation, because the constellation is the context that lets a reader find the star. A dot floating alone on a page is not a map.
And all three answered a specific reader's question. The southern studio answered "show me this one star, centred, so I can find it above me." The northern chart answered "show me where in the southern sky this star lives, as a data point among many." The teaching chart answered "show me why this star matters and how to read its coordinates." The dot did not move. The question did.
Which Scenario Is You
If you are commissioning or drawing a Menkent chart, the first question is not what projection to use. It is which reader you are drawing for.
If the print will hang above a bed in Wellington and the owner wants to look up and find their star, you are Scenario 1. Pick stereographic, centre on Menkent, plot a 20–25° field, draw Centaurus lightly, and let magnitude 2.06 read as itself against the neighbours.
If the print is one of many stars on a hemisphere-wide reference chart for readers who may live anywhere, you are Scenario 2. Pick an equal-area projection, plot every star to magnitude 6, compress the dot scaling so the brightest do not swamp the page, and label Menkent so northern readers can locate it without local sky knowledge.
If the chart is meant to teach — a poster in a classroom, a handout at a star party, a first star map for someone who has never read one — you are Scenario 3. Use a coordinate grid, exaggerate magnitude differences, draw the figure heavily, and let Menkent's coordinates become the worked example that teaches RA and Dec.
The dot is always the same dot. The map is the answer to a question. Know which question you are answering before the pencil touches the paper. A print of the Centaurus region drawn from these principles lives in our shop at /shop/ for readers who want the southern sky on their wall.
FAQ
What data source underlies the Menkent position on these maps?
The plotting values used across all three scenarios come from the HYG catalogue, version 41: apparent magnitude 2.06, right ascension 14.11139 hours, declination −36.36995 degrees, constellation abbreviation Cen for Centaurus. Every studio in the walkthrough draws from that same row. Different projections and different dot-size functions produce visually different maps, but the input coordinates are identical because the catalogue is the shared source of truth.
Why is Menkent's magnitude written as 2.06 and not a rounded 2?
Magnitude 2.06 is the measured value carried in the catalogue, and honest chartmaking preserves precision even when the visual output cannot resolve it. A dot rendered from magnitude 2.06 will not look distinguishable from a dot rendered from magnitude 2.0 to the naked eye on paper. But the catalogue value drives binning, ordering, and comparison logic upstream of the render, and rounding at that stage compounds into misleading dot-size relationships between stars.
Can a single star map be drawn without showing the constellation figure?
It can, and some studios prefer minimalist prints that plot only the star and its immediate neighbours without stick-figure lines. But the constellation figure is part of how readers locate the star in the actual sky. A minimalist Menkent print will be beautiful and hard to use. If the print's purpose is orientation — helping the owner find the star above them — the figure earns its place on the page.
How does southern declination affect what a northern viewer sees?
A star at declination −36.36995° never rises above the horizon for observers north of about +53.6° latitude. Between the celestial equator and that limit, the star rises but stays low, and atmospheric extinction dims it. A magnitude 2.06 star observed at 5° above a northern horizon may appear one to two magnitudes fainter than its catalogue value. On a chart, this is why northern hemisphere wall maps still plot the star at full catalogue magnitude — the map records the star, not the local viewing conditions.
Why is right ascension measured in hours instead of degrees?
Right ascension is tied historically to the Earth's rotation: the sky appears to turn 360 degrees in roughly 24 hours, or 15 degrees per hour. Measuring RA in hours makes it directly convertible to sidereal time and easier to use for observers timing when a star crosses the meridian. Menkent's RA of 14.11139 hours corresponds to about 211.67 degrees, but the hours notation is what appears in catalogues and on most star charts.
Is Menkent visible to the naked eye from the northern hemisphere?
From latitudes between roughly the equator and +53°, Menkent is visible during the months when Centaurus rises in the local sky, though it stays low and dims significantly. From latitudes further north, the star does not clear the horizon at all and cannot be seen without travelling south. On a chart, Menkent still appears as a magnitude 2.06 dot regardless of the reader's latitude, because the chart records the sky, not the viewer's window onto it.
What projection is best for a print centred on a single star?
Stereographic projection is the standard choice for single-star centred prints because it is conformal — it preserves the angular shapes of small regions around the tangent point. When a reader holds the print up to compare it with the sky, the pattern of stars around the centre matches what they see overhead. Other projections distort those angles and make the print harder to read against the actual sky, though they can be preferable for wider-field charts covering an entire hemisphere.
Does the zodiac include Centaurus or Menkent?
No. The zodiac is a coordinate band roughly 8 degrees on either side of the ecliptic, and Centaurus lies well south of it. Menkent, at declination −36.36995°, is far below the ecliptic and never enters the zodiacal band. The zodiac is a system of coordinates and constellation boundaries, not a set of stars with meaning attached — and Menkent belongs to the southern figure of the Centaur, not to any of the twelve zodiacal signs.
From the collection
New charts and 10% off your first print.
One email now with your code. No noise after.