A Deneb star map is not a picture of Deneb. Hear us out. The single mark at right ascension 20.69053 hours, declination +45.28034 degrees, apparent magnitude 1.25 in the HYG v41 catalogue is perhaps one percent of what a good chart of Deneb actually shows. The rest — the Cygnus outline, the coordinate grid, the magnitude scale, the stars omitted on purpose, the chosen projection — is editorial decision. Whether a print is worth its paper depends on which decisions the chartmaker made, and whether they are willing to tell you which ones. This piece walks through three readers meeting the same map.
The three readers do not exist. They are composite illustrations, drawn from the questions the desk fields most often. Picture each one holding the same sheet of paper under the same lamp. What they see is not the same map, because a map is not what is printed. A map is what a reader is equipped to read.
Scenario 1: The First-Time Buyer Deciding Whether a Deneb Print Is Honest
Imagine a reader who has never bought a star chart before. They saw Deneb named in a poem, or maybe traced the Summer Triangle from a balcony in July, and they want the constellation on a wall. They are not an astronomer. They can tell a good print from a bad print by feel — paper, ink, register — but they cannot tell a good chart from a decorated one. So they open the sheet and ask, plainly, whether this thing is true.
Here is what an honest Deneb print gives them, in the order they can check it.
First, a coordinate label attached to Deneb itself. On our reference chart, the star is plotted at RA 20.69053 hours and declination +45.28034 degrees. Those two numbers are the address. Right ascension is longitude on the celestial sphere, measured in hours from a fixed line through the vernal equinox; declination is latitude, measured in degrees from the celestial equator. A print that shows the grid — even faintly, even only on the margins — is telling the reader: these positions are checkable. A print that shows a constellation shape floating on black with no grid at all is a decoration. It may be beautiful. It is not a chart.
Second, a magnitude key. Deneb's apparent magnitude in the HYG v41 catalogue is 1.25. On a properly built chart, the dot for Deneb should be visibly larger than the dot for a fourth-magnitude star and visibly smaller than the dot for Sirius. If every star on the sheet is drawn the same size, the print has thrown away the single most important piece of information the sky gives us: how bright each star actually is. The reader can verify this in seconds. Find Deneb. Find a smaller companion in Cygnus. Are the dots different sizes? If not, the map does not encode brightness.
Third, a source line. Serious charts credit their catalogue. Ours cites HYG v41, an open-source compilation built on Hipparcos, Yale, and Gliese data. A print that names its catalogue is a print that expects to be checked. A print that does not is asking to be trusted on the strength of the frame.
For this reader, the test is not whether they understand every mark. It is whether the marks that matter — the grid, the magnitude scale, the source — are present and internally consistent. If they are, the print is honest. If they are missing, the reader is holding an illustration of Cygnus that happens to include Deneb, not a map of the sky in which Deneb lives.
Scenario 2: The Studio Cartographer Plotting Deneb from the HYG Catalogue
Now picture the person on the other side of the sheet: a studio cartographer opening the HYG catalogue and asking what a Deneb chart requires them to decide. This is not a philosophical exercise. Every mark on the finished print is a choice they had to make, and the choices are constrained by mathematics before they are shaped by taste.
The first decision is projection. Deneb sits at declination +45.28034 degrees — high in the northern sky, roughly halfway between the celestial equator and the north celestial pole. A stereographic projection centred on the north pole flattens the region around Deneb honestly; a Mercator projection stretches it; a cylindrical equal-area projection compresses the Cygnus outline into something the eye no longer recognises as a cross. A chart of Deneb that does not tell the reader which projection it uses has still made the choice — it has simply refused to disclose it.
The second decision is the magnitude cutoff. Deneb is bright, magnitude 1.25. If the chart plots down to magnitude 4, it shows perhaps five hundred stars in the frame around Cygnus and the reader sees a clean cross. If it plots down to magnitude 6 — roughly the naked-eye limit under a dark sky — the Milky Way's stellar background fills the panel and the constellation outline needs bolder lines to survive the density. If it plots to magnitude 8, the chart becomes a telescope map, and Deneb is one bright anchor in a crowded field. All three are legitimate. None of them is the default. The cartographer chooses, and the chart's whole character follows.
The third decision is the constellation outline itself. The IAU fixed the boundaries of Cygnus in 1930 — the region of sky the constellation officially owns — but the connect-the-dots outline every reader recognises is not IAU-sanctioned. It is a convention. H. A. Rey's mid-twentieth-century figures made one version popular; older celestial atlases drew different lines through the same stars. A chart that connects Deneb through Sadr to Albireo, tracing the long axis of the Northern Cross, is following one tradition. A chart that draws Cygnus as a swan with outstretched wings is following another. Neither is wrong. The cartographer picks a lineage and, if they are honest, names it in the legend.
The fourth decision, the quietest and most consequential, is what to leave out. A chart that includes every catalogued star within its declination band becomes an unreadable spatter. A chart that includes only Deneb becomes a dot. Somewhere between those extremes the cartographer draws a line — often at magnitude 5.5, often with named-star labels stopping at magnitude 3 — and the line is invisible to the reader who does not know to look for it.
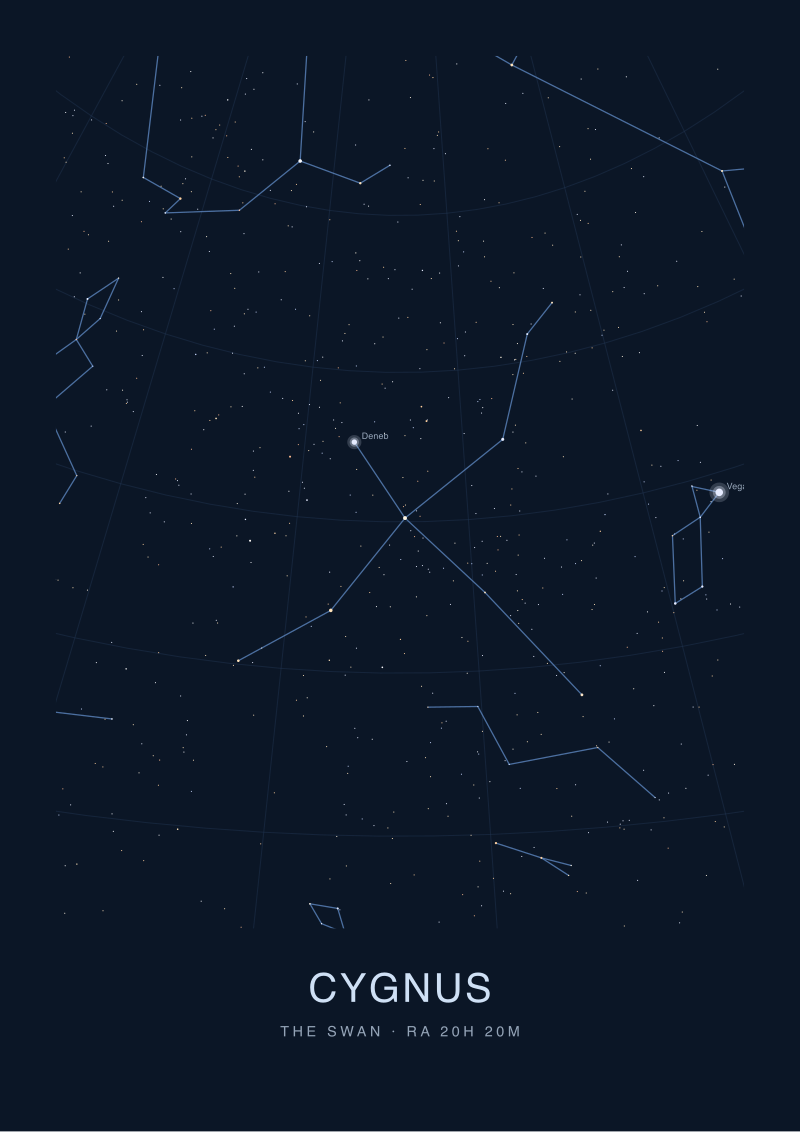 Cygnus
The print from this article · from €29.95
View the print →
Cygnus
The print from this article · from €29.95
View the print →
Scenario 3: The Reader Comparing Two Deneb Prints Side by Side
Let us say a reader has narrowed their choice to two prints. Both name Deneb. Both show the Northern Cross. Both are printed on decent paper. The reader wants to know which one is the better chart, not which one is the prettier object. Here is how a chartmaker reads the comparison.
Begin with Deneb's dot on each print. On one, the dot is a fixed size and the label reads "Deneb" in a serif face. On the other, the dot is scaled and there is a small numeral nearby — 1.25. That numeral is the apparent magnitude, and its presence tells the reader the chart has committed to a scale rather than a decorative hierarchy. The first print may still be honest; it may simply have moved the magnitude information into a legend. The reader's next move is to find the legend.
If a legend exists, it should show dot sizes stepping down from magnitude 1 through magnitude 5 or 6, each step labelled. If no legend exists, the dots on the sheet are aesthetic marks, not measurements. This is not a small thing. Magnitude runs backwards — smaller numbers mean brighter stars — and the whole grammar of a star chart depends on the reader being able to translate dot size to brightness reliably. A print without that key has removed the reader's ability to read the sky it claims to show.
Next, check the coordinate treatment. On one print, the grid is drawn across the whole field in a pale grey that lets Cygnus dominate. On the other, coordinates appear only as tick marks along the border. Both are valid. The border-tick version is cleaner and often more elegant on a wall; the full-grid version is more useful to a reader who wants to locate Deneb from a known reference point. What matters is that either version discloses the RA and declination scales somewhere the reader can find them. Ours anchors Deneb at 20.69053h, +45.28034°. If the print's numbers do not agree with the catalogue's numbers to at least three decimal places, one of them is wrong, and the catalogue is not.
Then look at what is around Deneb. On a good Cygnus chart, Sadr sits below Deneb along the cross's long axis, and Albireo — the beautiful double at the swan's beak — closes the figure to the southwest. On a decorative print, these companions may be drawn schematically, their true angular separations distorted for composition. Hold the two prints against each other and Deneb's neighbourhood will tell the reader everything about how much geometric truth each chart preserved.
The comparison, in the end, is not about which print is more beautiful. Both can be beautiful. It is about which print keeps its promises to the sky it depicts.
What All Three Readings Share
Across the three scenarios, the same handful of marks kept doing the work. The coordinate pair — RA 20.69053h, declination +45.28034° — anchored the chart to a real place on the celestial sphere. The magnitude value — 1.25 — anchored the dot size to a real brightness. The catalogue attribution — HYG v41 — anchored the whole chart to a checkable source. And the constellation outline anchored the reader to a tradition of drawing that has been continuously revised since antiquity.
The first-time buyer used these marks as a test of honesty. The studio cartographer used them as constraints on their own choices. The comparing reader used them as a diff between two prints. The marks themselves did not change; what changed was the question each reader brought to them.
What all three share is a working assumption that a star chart is a record of decisions, not a picture of the sky. The sky itself does not have grid lines, magnitude keys, or constellation outlines. Every one of those was placed there by a chartmaker who decided the reader needed it. A good print is one where those decisions are visible and defensible. A bad print is one where the decisions have been hidden behind aesthetics, leaving the reader unable to tell where the sky ends and the styling begins.
The reason to know this is not academic. A wall print of Deneb sits in a room for years. The reader will look at it thousands of times. Over that span, an honest chart teaches — it gradually trains the eye to read magnitudes, to recognise the Cygnus geometry, to locate declination bands by feel. A decorative chart, however handsome, teaches nothing. It is a photograph of an idea of the sky. The composite readers above are all, in different ways, refusing to accept that trade.
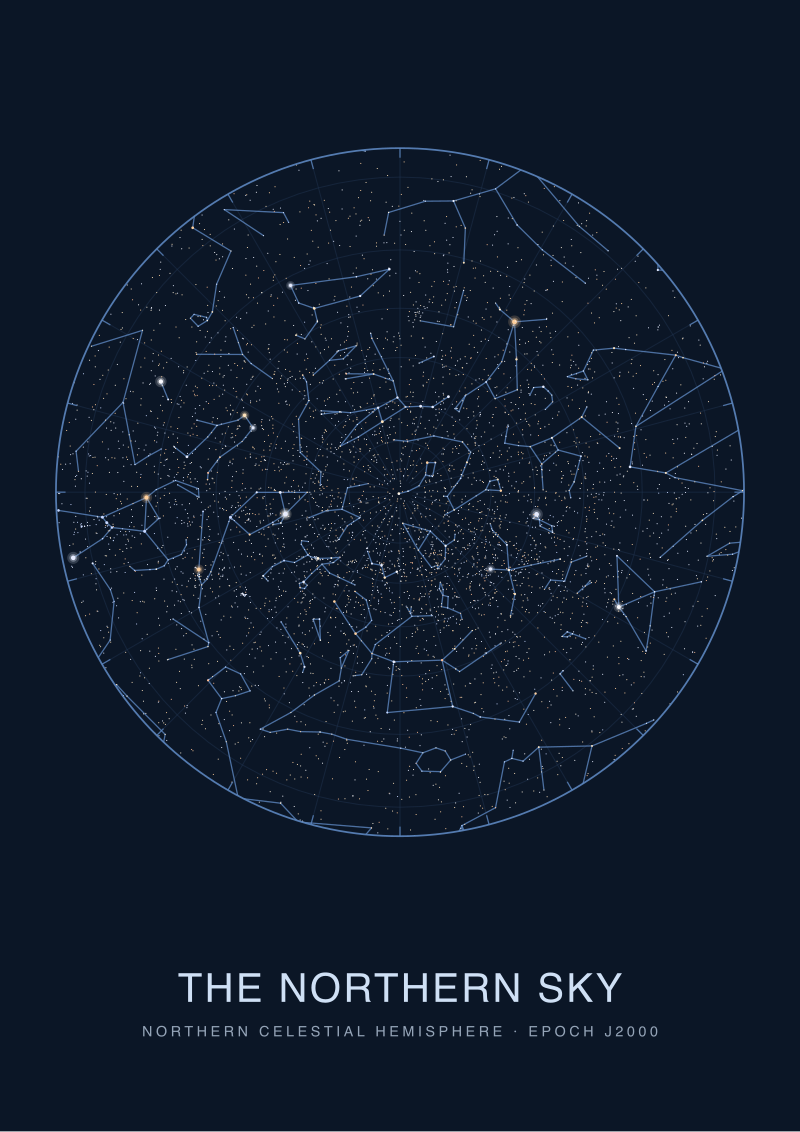 The Northern Sky
The print from this article · from €29.95
View the print →
The Northern Sky
The print from this article · from €29.95
View the print →
Which Scenario Is You
If you are about to buy your first star chart, you are the first reader. Your job is not to become an astronomer before the print arrives. Your job is to check three things — the grid, the magnitude key, the source line — and to walk away from any print that hides any of them.
If you make charts, or you are thinking of commissioning one, you are the second reader. The decisions in front of you are projection, magnitude cutoff, outline tradition, and omission. Your only obligation is to make those decisions deliberately and to declare them in the legend so the reader can audit your work.
If you are choosing between prints you already like, you are the third reader. The comparison is not which sheet looks better on the wall. It is which sheet remains true when a reader who knows Deneb sits down in five years and asks it a question. The one that survives that test is the one worth framing.
At Sky Atlas, our own star map prints of Cygnus and the Summer Triangle live at /shop/, plotted from the same HYG v41 positions used throughout this piece. They are not the only honest charts of Deneb in the world. They are simply ones where the decisions above are made in the open.
FAQ
What are the exact coordinates of Deneb on a star map?
Deneb is plotted at right ascension 20.69053 hours and declination +45.28034 degrees, using the HYG v41 catalogue positions. Right ascension gives the star's east-west position on the celestial sphere in hours (there are 24 hours around the full circle), and declination gives its north-south position in degrees from the celestial equator. Any honest chart should agree with these numbers to at least three decimal places; if it doesn't, the chart is working from a different or older source and should say so.
How bright is Deneb, and how is that shown on a chart?
Deneb's apparent magnitude in the HYG v41 catalogue is 1.25, placing it firmly among the first-magnitude stars visible to the naked eye. On a well-built chart, this brightness is encoded in the size of the dot: brighter stars get larger dots, fainter stars get smaller ones. The magnitude scale runs backwards — lower numbers are brighter — so Deneb's dot should be visibly larger than the dot for a magnitude-3 or magnitude-4 companion star in the same field.
Why is the constellation outline for Cygnus drawn differently on different maps?
Because the connect-the-dots outline is not fixed by the IAU. What the IAU standardised in 1930 was the boundary of Cygnus — the region of sky the constellation owns — not the lines drawn through its stars. The Northern Cross outline that runs Deneb through Sadr to the swan's beak is one popular convention, but atlases across the centuries have drawn Cygnus with wings, without wings, as a bird in flight, and as a bare cross. A chartmaker picks a lineage; the reader is free to prefer another.
What does the grid on a Deneb star map actually do?
The grid encodes the coordinate system — usually right ascension along one axis and declination along the other. It lets a reader locate Deneb by its address (20.69053h, +45.28034°) rather than by its shape alone. Grids can be drawn across the whole field or reduced to tick marks along the margins. Both are legitimate; the aesthetic choice is real, but the coordinate scale must exist somewhere on the sheet or the chart has stopped being a map.
What catalogue should a Deneb chart cite?
For open studio work, the HYG catalogue — currently at version 41 — is a solid standard. It compiles data from Hipparcos, the Yale Bright Star Catalogue, and the Gliese catalogue of nearby stars, and it is publicly checkable. Charts based on it can be audited by anyone with a copy of the catalogue and a plotting library. A print that names its source is a print inviting scrutiny; a print that does not is asking for trust the reader has no way to verify.
Why is Deneb usually plotted high on a northern-sky chart?
Because its declination is +45.28034 degrees, placing it about halfway between the celestial equator and the north celestial pole. On a projection centred on the northern sky, that puts Deneb high in the frame; on a whole-sky projection, it lands in the upper-middle of the northern hemisphere half. The projection choice matters — a stereographic projection preserves the Cygnus shape faithfully around Deneb's declination, while some cylindrical projections stretch or compress the constellation noticeably.
Does an artistic star print without a magnitude key still count as a map?
Not in the sense a chartmaker would use the word. Without a magnitude key, dot sizes become an aesthetic choice rather than a measurement, and the reader loses the ability to tell a first-magnitude star like Deneb from a fainter companion. Such a print can be beautiful and can honestly represent the position of the constellation, but it has traded the map's core function — teaching the eye to read brightness — for compositional cleanliness. Whether that trade is worth it is the reader's call, made in the open.
From the collection
New charts and 10% off your first print.
One email now with your code. No noise after.