There is a pattern we notice every time a reader writes in about a specific star on one of our charts: they ask about the mark, not the number. Saiph — apparent magnitude 2.07, plotted at right ascension 5.79594 hours and declination -9.66961 degrees in Orion, per the HYG v41 catalogue — is a case we get more often than most. The dot is small. The reader assumes the star is small, or dim, or somehow secondary. It is none of those things. What they are asking about is a chain of editorial decisions the chartmaker made before any ink touched paper.
The Dot Size Fallacy: Why Saiph's Mark Is Not the Star's Size
There is a pattern we see in nearly every letter about Orion: the reader interprets a dot's diameter as a claim about the star's diameter. It is not, and it never has been, and yet the misreading is so consistent that we treat it as a structural problem of the medium rather than a reader's error.
The dot on a star chart is a magnitude glyph. It encodes brightness — how much light reaches the eye from a given source — and nothing else. Saiph is drawn at 2.07 magnitude, which places it comfortably in the second-magnitude tier: bright enough to anchor a constellation figure, dim enough to sit below the eye's first sweep across Orion. The scale we use, inherited from Hipparchus and formalised in the nineteenth century, is logarithmic and backwards. Each step of one magnitude corresponds to roughly a 2.512-fold change in received flux, and lower numbers mean brighter stars. Saiph at 2.07 is receiving roughly the light output that a first-magnitude star would deliver diminished by a single step on that ladder. The dot the chartmaker draws for it is smaller than the dots for Rigel or Betelgeuse not because Saiph is a smaller object in space — it is not — but because the reader's eye, standing outside on a clear night, will perceive it as less bright.
What compounds the misreading is a second convention nobody talks about: the dot's edge is intentionally soft on our plates. A hard-edged mark reads as a bounded object. A soft mark reads as a point of light. This is a decision made at the ink stage, not the plotting stage, and it is one of the reasons we prefer letterpress and litho origins for our star maps over the sharp digital grid. Saiph's mark, at the scale we typically print, is about a millimetre and a half across. That millimetre and a half is a translation of 2.07 magnitudes into ink. It is not a size claim about a star roughly 650 light years away that is, by every physical measure, considerably larger than our own Sun.
The Coordinate Silence: What 5.79594h and -9.66961° Actually Do
Every chart we produce is silently governed by two numbers per star, and Saiph gives us a clean case to open the machinery. Its right ascension is 5.79594 hours. Its declination is -9.66961 degrees. Neither number appears on the finished print. Both determine everything the reader sees.
Right ascension is the celestial analogue of longitude, measured in hours because the sky rotates through 24 of them a day. Saiph's 5.79594 hours puts it at roughly 5 hours 47 minutes 45 seconds along that eastward sweep — deep in the winter Milky Way, on the same meridian as the rest of the Orion figure. Declination is the celestial analogue of latitude, measured in degrees north or south of the celestial equator. Saiph's -9.66961 degrees means it sits just under ten degrees south of the equator, which is why the star, and the constellation it anchors, is visible from both hemispheres. That single negative sign is the reason a reader in Chile and a reader in Norway can both write us about the same dot.
The chartmaker's decision, then, is which projection to use to turn those two numbers into a flat mark on a rectangular sheet. A stereographic projection preserves shapes near the projection centre but stretches them at the edges. A gnomonic projection preserves great circles as straight lines, which matters if you want the belt of Orion to lie in a true line. A cylindrical equatorial projection makes coordinate reading trivial but distorts the polar regions into taffy. We choose per chart, and Saiph moves accordingly. On a stereographic plate centred on the winter Milky Way, Saiph sits comfortably to the lower left of the Orion figure. On a gnomonic plate cut for a hemisphere-wide print, the same star moves a measurable distance and its relationship to the belt and to Rigel shifts. The star has not moved. The map has.
There is also the matter of epoch. Coordinates are stated for a reference date — 2000.0 is standard, and it is the epoch that governs the HYG v41 numbers we work from — because precession slowly wobbles the celestial coordinate grid over centuries. A chart cut for 2050.0 will place Saiph at coordinates a fraction different from the ones we quoted above. This is not correction of a mistake. It is a working chartmaker's admission that the grid itself drifts against the sky.
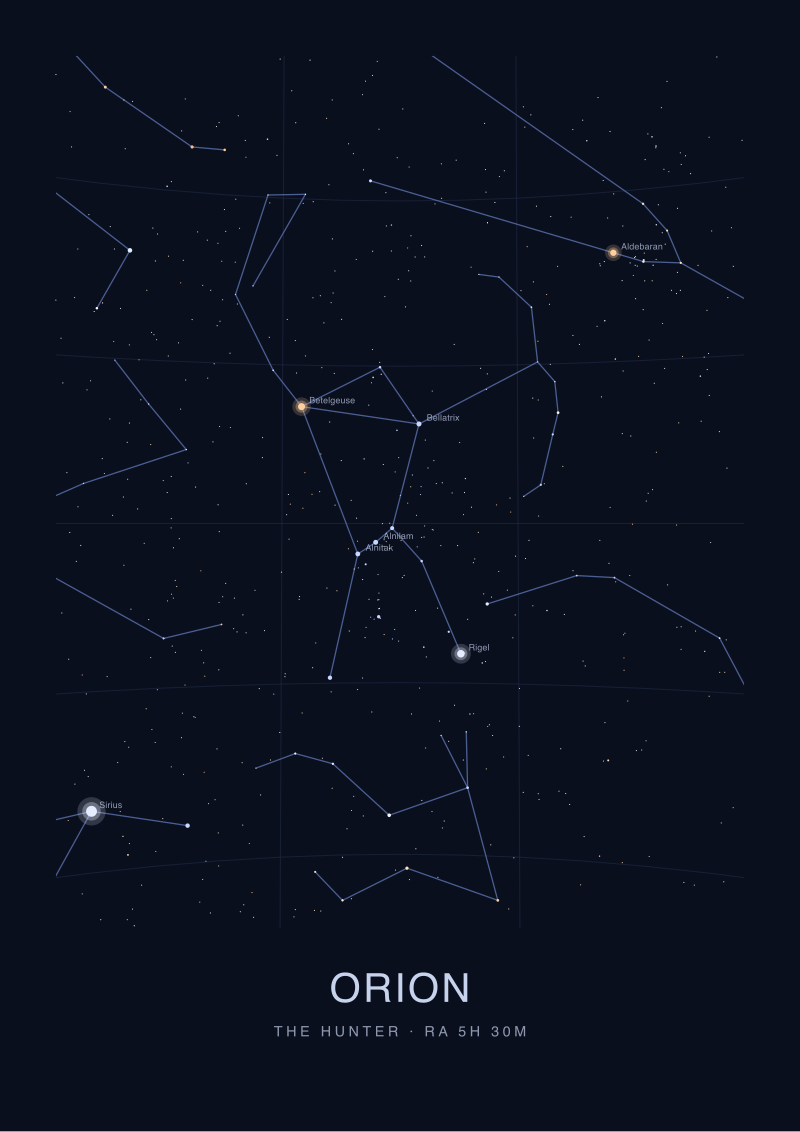 Orion
The print from this article · from €29.95
View the print →
Orion
The print from this article · from €29.95
View the print →
The Constellation Line Convention: Why Saiph Sits Where It Sits in Orion
There is a pattern we see when readers trace Orion with a finger: they assume the lines connecting the stars are given. They are not. The lines are a convention, decided by the chartmaker, and Saiph's position in that figure is the clearest example of what a convention actually costs.
The lines that make Orion a hunter are not in the sky; they are in the studio, and every chartmaker draws them slightly differently.
The eighty-eight constellations as we know them were formalised as bounded regions of sky by the International Astronomical Union in 1930 — a committee decision, drawn as polygons on the celestial sphere, with each star belonging administratively to exactly one region. Saiph belongs to Orion by that ruling, and its 5.79594-hour, -9.66961-degree coordinates fall inside the Orion polygon. But the stick figure a reader recognises — the shoulders at Betelgeuse and Bellatrix, the belt of three stars, the sword hanging from the belt, and the two feet at Rigel and Saiph — is a much older tradition, and no committee ever ruled on it.
Saiph is the eastern foot, opposite Rigel. On some charts, we draw a line from Alnitak, the eastern belt star, down to Saiph as a single leg. On others, we route the line from a different vertex, or we omit the connection entirely and let the reader's eye supply it. The Arabic naming tradition, from which the name Saiph descends — the word is a shortening of a longer Arabic phrase referring to a sword, mis-attached at some point in the transmission history — did not draw the figure our way at all. Greek and later European traditions cast Orion as a hunter with a raised club and a lion's pelt; the Arabic star-naming corpus, which gave us most of the star names we use tonight, described a giant figure whose limbs were charted differently. The line convention we inherit is a Ptolemaic-into-Renaissance compromise.
What this means editorially is that Saiph's role — foot, corner, anchor — is a role the chart assigns it, not a role the star performs in space. If we drew Orion as a rectangle of its four brightest corner stars with no interior figure, Saiph would still be at 5.79594 hours and -9.66961 degrees, but a reader would stop asking why it is a foot and start asking why it is a corner. The star is stable. The story is not.
The Magnitude Cutoff: The Editorial Decision No Chart Ever Discloses
The single editorial decision most consequential to how Saiph appears on any given chart is one the chart itself never states. It is the magnitude cutoff: the dimmest brightness the chartmaker chose to plot.
Every chart has one. If we cut at magnitude 4.5, Saiph at 2.07 is comfortably above the threshold and appears as a mid-tier dot in a field of a few hundred plotted stars. If we cut at magnitude 6.0 — roughly the limit of the unaided human eye under dark skies — Saiph appears in a field of several thousand plotted stars, and its relative prominence collapses. It becomes one bright dot in a crowd, rather than one of the visible anchors on a sparser plate. The star has not changed. The company it keeps has.
The cutoff is where a chart's audience is silently declared. A naked-eye planisphere for a schoolchild uses a shallow cutoff — magnitude 3.5 to 4.0 — because the goal is pattern recognition, and thousands of dots defeat pattern recognition. A deep-sky reference plate cuts at 6.5 or deeper because the goal is completeness for someone with a small telescope. A decorative print in a living room, meant to be legible at three metres, may cut as shallow as 3.0 and still work. We think about this cutoff before we place any dot, including Saiph's, because the cutoff determines the visual weight of every mark that survives it.
There is a second, quieter decision layered on top of the cutoff: the scaling curve. A chart that maps magnitudes linearly to dot diameter will produce very small dots for faint stars and very large dots for the brightest. A chart that maps them with a compressed curve will keep the range of dot sizes narrower and preserve reading clarity. Saiph at 2.07, on a compressed curve with a magnitude-6 cutoff, will look almost identical in size to Bellatrix at 1.64 magnitude. On a linear curve with a magnitude-3.5 cutoff, the same two stars will look markedly different. Neither is wrong. Both are editorial choices, made in service of the reader the chart imagines.
Nothing in the finished plate discloses the cutoff or the curve. The reader is left to infer them, and most readers never do. We think they should. The dot is not the star. The dot is the star as filtered through decisions the chartmaker made about who the reader is and what they will do with the map.
So What Do You Actually Do
If you are reading a star chart — ours or anyone else's — the useful move is to reverse-engineer the two decisions the chartmaker did not tell you: the magnitude cutoff and the projection. Count the dots in a familiar patch of sky. If Orion contains only its brightest seven or so stars, the cutoff is shallow and the chart is built for pattern recognition. If Orion contains a dense scatter of secondary stars around the main figure, the cutoff is deep and the chart is a reference document. Trace a straight line between two stars you know are on the same celestial meridian. If the line bends visibly, the projection is stereographic or another shape-preserving choice. If it stays straight, you are likely on a gnomonic plate.
If you are commissioning a chart, or drawing one, decide those two things first and let everything else follow. The dot size for Saiph, the line from Alnitak to its position, the coordinate grid you may or may not print in the margin — none of these are the primary decision. The primary decision is the reader you are drawing for. A chart that tries to serve every reader at once serves none of them well.
The one number to hold onto from this piece is 2.07 — Saiph's apparent magnitude. That number is what should decide whether the mark you draw for it is a large ink point or a small one, whether it earns a name label or sits anonymous, whether it anchors a stick figure or hides in a coordinate field. Every other choice on the chart is a consequence of that number and the cutoff you set against it. The math is closed. The map is not — the map is the argument you make with the math.
From the collection
New charts and 10% off your first print.
One email now with your code. No noise after.