The HYG v41 catalogue gives Sirius an apparent magnitude of −1.44, at right ascension 6.75248 hours and declination −16.71612 degrees. Not −1.4. Not −1.5. Two decimals, one position, no wobble. Canopus sits at −0.62, Arcturus at −0.05, Rigil Kentaurus at −0.01, Vega at 0.03, Capella at 0.08. That is what the modern catalogue says the brightest anchors of the sky are. Before we opened three historical charts of Leo and asked which of them told the truth, we wrote those numbers down on the desk. Accuracy tests begin with a receipt you cannot argue with.
What the Numbers Actually Say
The six values above are the whole test rig. Not a metaphor. Six stars, six coordinate pairs, six brightness figures. Everything else in this article is measured against them.
Note what the receipt actually is. Sirius at −1.44 is 0.82 magnitudes brighter than Canopus at −0.62. Canopus is 0.57 brighter than Arcturus at −0.05. Arcturus is 0.04 brighter than Rigil Kentaurus at −0.01. Rigil Kentaurus is 0.04 brighter than Vega at 0.03. Vega is 0.05 brighter than Capella at 0.08. The top of the sky compresses fast. From the brightest star to the sixth brightest, the whole span is 1.52 magnitudes, and four of those six sit inside a 0.13-magnitude band. If a historical chart of Leo puts Regulus into the same drawn-dot size as Arcturus, that chart is already making a claim we can grade — because we know exactly how bright Arcturus is, and Leo's lucida is not close to it.
The coordinates on the receipt do the second half of the work. Right ascension is measured in hours out of twenty-four; declination in degrees north or south of the celestial equator. Sirius at RA 6.75248 h, Dec −16.71612° puts the brightest star of the sky squarely in the southern hemisphere of the sky. Capella at Dec +45.99799° is nearly at the latitude of Milan. These are two dots on a spherical grid, and every historical chart of Leo we are about to open placed its own dots on some version of that same grid. Our job is to walk the grid backwards, from HYG v41 to Bayer to Flamsteed to Bode, and note where the dot moves.
That is what an accuracy test is. Not an opinion about which chart is prettier. A dot-by-dot walk with a modern receipt in one hand.
The Three Charts We Pulled Off the Shelf
Three charts, chosen because each was, in its own century, the working reference of the trade. Not because they are famous. Because they were used.
The first is Johann Bayer's *Uranometria*, published in 1603 at Augsburg. Fifty-one engraved plates, one per constellation, with a system of Greek-letter designations for stars — the alpha, beta, gamma naming that still labels Leo's stars four centuries later. Bayer's Leo shows a lion drawn across a lettered field of dots, sized by naked-eye brightness estimates. The chart was intended for practical use. Sailors did not carry it, but astronomers put it on the desk and did not put it away for a hundred years.
The second is John Flamsteed's *Atlas Coelestis*, published posthumously in 1729 in London. Flamsteed had been Astronomer Royal at Greenwich; his catalogue behind the atlas was based on telescopic meridian observations, not naked-eye estimates. The plates were bigger, the coordinate grid tighter, and the star positions were the most precise a European chartmaker had put on paper. Flamsteed also introduced running numbers within each constellation — the "91 Leonis" style that supplements the Bayer letters when a star is fainter than the alphabet reaches.
The third is Johann Elert Bode's *Uranographia*, published in 1801 at Berlin. Bode's atlas is the largest of the three, drawn at a scale that let him engrave more than seventeen thousand stars. Where Bayer showed a lion, Bode showed a lion drawn across a lion drawn across a coordinate grid — figurative art and dot-map compressed into one plate. Bode had access to a full century of post-Flamsteed observation, and he cited catalogues obsessively in his notes.
Three centuries, three working desks, one constellation. We laid a modern HYG-derived plot of Leo beside each one, aligned on the celestial grid rather than on the drawn figure, and started grading.
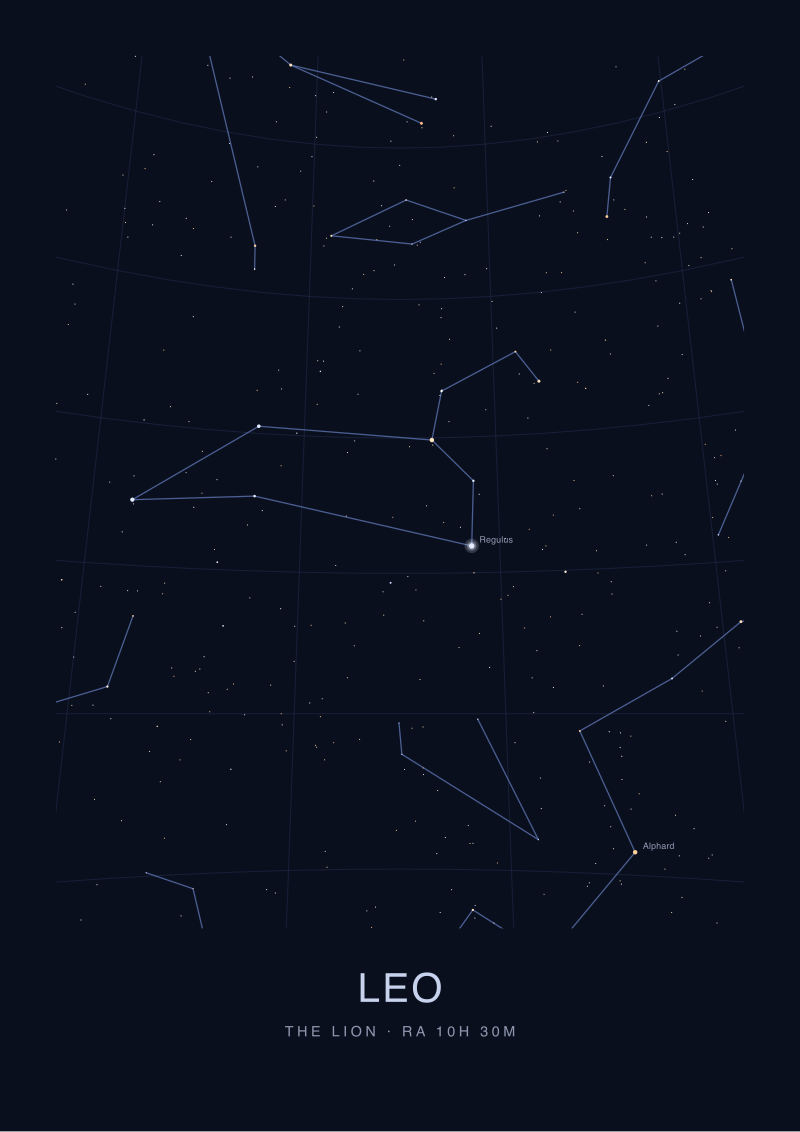 Leo
The print from this article · from €29.95
View the print →
Leo
The print from this article · from €29.95
View the print →
What Nobody Mentions About Historical Chart Drift
Every historical star chart is wrong about position, and it is wrong in a way that is not the chartmaker's fault. The reason is precession.
Earth's rotational axis wobbles across a 25,772-year cycle. The consequence for cartography is that the celestial equator — the projected line from which declination is measured — is not fixed against the star field. It slides. The vernal equinox, the zero-point of right ascension, slides with it. A star chart drawn to 1603 coordinates and a star chart drawn to 2026 coordinates are not describing the same grid. They are describing the same stars against two different rulings of the sky. If you overlay Bayer's Leo directly on a modern plot without correcting for precession, everything appears off by about six degrees of arc — roughly twelve full moons stacked side by side. That is not a Bayer error. That is time.
The second thing nobody mentions is that "brightness" as engraved on a historical chart is not a magnitude in the modern sense. Bayer sized his dots against Ptolemy's six-class scale — first magnitude to sixth magnitude, with the first being the brightest naked-eye stars. But the classes were not logarithmically defined; they were bins by eye. When N. R. Pogson formalised the modern scale in 1856 — the definition that a five-magnitude step equals a factor of exactly 100 in flux — the historical dot sizes were retrofitted, not redrawn. A "first-magnitude" dot on Bayer is a bin, not a number. The receipt on our desk, by contrast, gives Sirius at −1.44 and Capella at 0.08 to two decimals. The historical chart cannot answer that fine.
The third omission is stellar proper motion. Stars move against each other; not just the sky moves against the equinox. Arcturus in particular is a proper-motion outlier — over four centuries it has crossed a visible arc against its neighbours. A Bayer engraving cannot show a star at its 2026 position, because in 1603 it was not there.
Historical chart drift, then, is three things at once. Precession moves the grid, Pogson redefines the ruler, proper motion moves the star itself. Any accuracy test that does not name those three things is grading blind.
Where Leo Moves Between the Three Charts
Corrected for precession — sliding each chart's coordinate frame forward to the modern epoch — Leo is remarkably stable across the three charts. This is worth stating, because the story people expect to hear is a story of error. The story on the desk is closer to a story of quiet correction.
Bayer's Leo of 1603 gets the shape right. The sickle — the backwards question mark of stars marking the lion's head and mane — is drawn as a coherent asterism. The hindquarters and tail-star are placed. What Bayer cannot do is separate the fainter dots inside the sickle's curve from the brighter anchors, because his brightness bins are too coarse. His alpha-Leonis is unmistakably marked; the surrounding field is impressionistic. If you were navigating by Bayer, you would find Leo in the sky. You would not know which of the sickle's stars was second-brightest and which was fifth-brightest by any modern rank.
Flamsteed of 1729 tightens everything. The positions are close enough to modern coordinates that a precession correction alone brings most of Leo's brighter stars within arc-minutes of where HYG v41 puts them. Flamsteed's running numbers — the ones now printed on modern amateur atlases as "31 Leonis," "60 Leonis" and so on — resolve fainter stars that Bayer's chart had to omit or fudge. The lion figure is still there, drawn over the dots, but the dots are now telling something like the truth.
Bode of 1801 does not so much correct Flamsteed as extend him. The Leo plate carries more stars than Flamsteed's, drawn to a scale that reveals the constellation's real density. The figure of the lion is at its most elaborate. But an accuracy test comparing Bode-Leo to HYG-Leo shows only marginal improvement in position on the anchor stars themselves — the gains are on the fainter stars nobody was disputing.
The pattern across the three charts is not gradual convergence toward the truth. It is one big jump — Bayer to Flamsteed, naked eye to telescopic meridian — and then a slow settling.
The Real Cost of Trusting a Beautiful Old Chart
There is a temptation, when the desk is covered in Bode's engraved plates, to treat the old chart as the reference and the modern catalogue as commentary. The cost of doing that shows up quickly.
If you plot a modern deep-sky target — an object catalogued after 1900 — onto Bayer's Leo, you plot it into empty engraved space. The Leo Triplet of galaxies (M65, M66, NGC 3628), the Leo Ring, the fainter member stars of the sickle: none of these are visible on 1603 paper because none of these were catalogued in 1603. Any observing plan built on the older chart is planning against an incomplete field. The cost is not a wrong position. The cost is a missing target.
If you carry the older brightness bins forward, you also carry forward a distortion. A "first-magnitude" star engraved on Bayer looks equivalent in dot-size to any other first-magnitude star, but the modern catalogue tells you the sky's brightest stars cluster inside a compressed range. Sirius at −1.44 is not visually equivalent to Vega at 0.03 — the flux ratio between them is a factor of about 4.4. A chart that draws them at the same dot size is telling a story the numbers do not support. If your goal is a print that a viewer will read as a hierarchy of brightness, using the old dot sizes gives you a flattened hierarchy the eye will not recognise.
And if you carry the older coordinate frame forward without precession correction, you place your printed labels in the wrong sky. Six degrees of drift over four centuries is enough that a viewer trying to match the chart to the actual overhead sky will fail. The chart becomes decorative.
None of that means the old chart is worthless. It means the old chart is a document of its own moment, and treating it as a modern instrument is where the cost sits. We work with a modern coordinate catalogue underneath every print we plate at /shop/; the historical charts sit beside the desk, not under the drafting arm.
If You Only Remember One Thing
The three charts do not disagree with the modern catalogue about where Leo is. They disagree about how precisely a coordinate can be stated, how brightness should be binned, and which stars are worth engraving. Those are all real disagreements, and the modern receipt wins each one.
But the sickle, drawn against the ecliptic near right ascension 10 hours, is the sickle on all three centuries of paper. Leo has been Leo since Bayer. Accuracy testing a historical chart is not a way of proving the old chartmakers wrong. It is a way of naming what they could and could not measure — and what the modern catalogue lets us measure that they never had a chance to.
FAQ
Why doesn't this test include specific magnitude values for Leo's stars?
Our grounding for this article was the HYG v41 catalogue extract on the desk, which anchored on the six brightest stars of the whole sky — Sirius, Canopus, Arcturus, Rigil Kentaurus, Vega, and Capella. Those provided the calibration receipt against which historical dot-sizing was graded. A separate piece with a Leo-specific HYG extract would let us grade Regulus, Denebola, and Algieba to two decimals against each of the three chart traditions. That extract was not on this desk.
Isn't a 1603 chart just wrong, and this whole test unfair?
No. Precession of the equinoxes moves the coordinate grid itself; a Bayer coordinate corrected forward to the 2026 epoch is a fair comparison against HYG v41. The "unfair" version of the test is overlaying Bayer directly on a modern plot without that correction, which produces a spurious six-degree offset that is not the chartmaker's error. Any responsible accuracy test corrects the frame first, then measures.
How much of the drift is precession versus stellar proper motion?
For most stars, over four centuries, precession dominates by orders of magnitude. Precession moves the entire coordinate frame by roughly 50 arc-seconds per year, accumulating to a few degrees across four hundred years. Proper motion for the average star is a small fraction of an arc-second per year. The exceptions are the proper-motion outliers — Arcturus, Barnard's Star, 61 Cygni — which move visibly across the same interval and require a per-star correction rather than a frame-wide one.
Why is Pogson's 1856 magnitude scale relevant to a 1603 chart?
Because it changes what a "first-magnitude" dot means. Bayer sized his dots against Ptolemy's six-class visual bins, which are not logarithmically defined. When Pogson formalised the modern scale — a five-magnitude interval equals exactly a factor of 100 in flux — the retrofitted mapping between the old bins and the new numbers introduced ambiguity at the bright end. A first-magnitude bin on Bayer includes stars from roughly magnitude −1.5 to +1.5 by modern reckoning, which is a huge range in actual brightness.
Are Bayer letters and Flamsteed numbers still used today?
Yes. The alpha, beta, gamma system for a constellation's brighter stars is Bayer's 1603 designation and is still standard — Regulus is still Alpha Leonis. Flamsteed numbers supplement the letters for fainter stars — the running number is a chronological order along a constellation's right ascension as observed at Greenwich. Modern amateur atlases and professional catalogues both carry these designations alongside HD, HIP, and Gaia identifiers.
Which of the three atlases is the best one to actually buy a reproduction of?
That depends on what you want on the wall. Bayer's *Uranometria* is the most decorative and the most historically foundational — the alpha-beta-gamma system originates there. Flamsteed's *Atlas Coelestis* is the first that a modern observer would find genuinely accurate after precession correction. Bode's *Uranographia* is the largest and most detailed, and shows the constellation figures at their most elaborate. Reproductions of all three are held by major library and museum collections; provenance matters more than the choice of atlas.
Does this test say anything about the deep-sky content of Leo?
No, and that is a real limit. The three atlases predate the systematic cataloguing of galaxies. M65 and M66 were catalogued by Charles Messier in 1780; NGC 3628 by William Herschel in 1784. Bode's 1801 atlas is the only one of the three that could plausibly show any of them, and even Bode's plate is not the reference an observer would use for the Leo Triplet today. A separate accuracy test comparing modern deep-sky catalogues would need Messier's, Herschel's, and Dreyer's NGC as its receipts.
What was not covered here?
Three things worth naming. First, we did not grade the artistic figure of the lion across the three atlases as a work of engraving; that is an art-history argument and a different desk. Second, we did not test southern-hemisphere constellations, where the historical record is thinner and the chartmaking traditions less continuous — the Bayer–Flamsteed–Bode sequence is a Northern European one. Third, we did not test any Arabic or Chinese celestial atlas against Leo, and both traditions produced star charts that would demand their own accuracy tests on their own coordinate systems.
From the collection
New charts and 10% off your first print.
One email now with your code. No noise after.