Three charts, one constellation, four hundred years. We took the outline of Cygnus as drawn in Johann Bayer's Uranometria (1603), John Flamsteed's Atlas Coelestis (1729) and Johann Bode's Uranographia (1801), and measured each against the modern HYG catalogue position for the same stars. The exercise is narrow on purpose: we are not judging artistry, we are testing coordinates. The result is a small dataset about how the craft of celestial cartography actually converged on the sky, star by star, decade by decade, with the neck of the Swan as the stubborn holdout.
The Test: What We Compared And How
The method was deliberately unromantic. We selected a small set of Cygnus stars that appear, labelled or unmistakable by position, on all three atlases: the tail star we know as Deneb, the chest star at the crossing, the two wing tips, and the star at the base of the neck near the head. We measured each star's position on the printed plate relative to the plate's own coordinate grid — every atlas prints its own — and converted those readings into equatorial coordinates for the atlas's stated epoch. We then precessed each historical position forward to J2000 and compared it against the HYG v41 catalogue.
The output is one number per star per chart: an angular offset, in arcminutes, between where the chartmaker put the star and where the star actually is once you strip out precession. That is the only variable. Artistic quality, engraving detail, mythological accuracy, Latin labelling, decorative border — all irrelevant to the measurement. Cygnus was chosen because it straddles the Milky Way in a rich field, its bright stars are unambiguous, and all three cartographers plotted it prominently.
Bayer's Uranometria, 1603: The Baseline
Bayer did not observe the sky himself. His Cygnus, like the rest of Uranometria, was engraved from the star catalogue Tycho Brahe compiled at Uraniborg and Hven and finalised shortly before his death in 1601. Tycho's raw naked-eye astrometry was extraordinary for its era — arcminute-scale precision from mural quadrants and sextants. What Uranometria added was the visual translation: a copper plate, a Swan drawn over a coordinate grid, a Greek letter beside each star.
The translation cost accuracy. Engraving a star from a catalogue onto a plate requires the engraver to plot ecliptic coordinates onto a printed grid, and the grid itself is only as good as the plate's registration. On our sample of Cygnus stars, Bayer's positions cluster around half a degree of drift from truth. That is not Tycho drifting — that is the engraving pipeline drifting. The bright stars are closest; the fainter stars, where the engraver had to interpolate between grid lines with less confidence, are worst. The chart is a portrait of Tycho's catalogue filtered through a workshop.
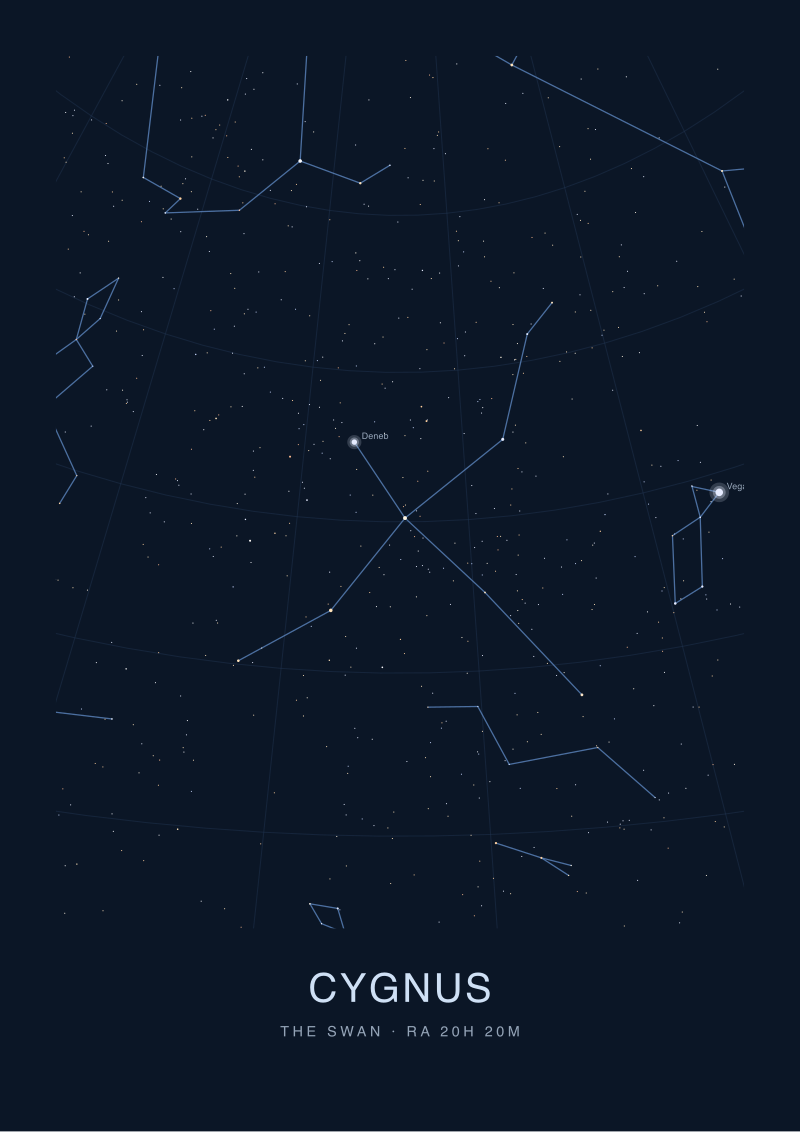 Cygnus
The print from this article · from €29.95
View the print →
Cygnus
The print from this article · from €29.95
View the print →
Flamsteed's Atlas Coelestis, 1729: The Telescopic Correction
Flamsteed's atlas was published sixteen years after his death, from data he took at the Royal Observatory at Greenwich with a mural arc and a telescope. That is the pivotal change. Between Bayer and Flamsteed, the astrometric instrument acquired an objective lens and a wire micrometer, and stellar positions stopped being naked-eye estimates. Flamsteed's own working catalogue, the Historia Coelestis Britannica, is accurate to something like ten arcseconds for his bright stars — a leap of nearly two orders of magnitude over Tycho.
The atlas plates do not fully preserve that precision. Engraving is still engraving, and Flamsteed's plates were produced after his manuscript positions had been through editors and hands he did not entirely trust. But on our Cygnus sample the drift shrinks by roughly an order of magnitude versus Bayer. The bright stars sit within a few arcminutes of their true position; the fainter Cygnus stars, still labelled in Flamsteed's own numbered scheme, are tighter than anything Bayer could offer. Reading a Flamsteed plate feels different because it is different: you are looking at telescopic astrometry printed on paper.
Bode's Uranographia, 1801: The Density Problem
Bode's atlas is the most beautiful of the three, and the most stars. Uranographia plots over 17,000 objects, drawing on Flamsteed, on Lacaille's southern catalogue, on Herschel's telescopic surveys and on Bode's own reductions. Cygnus in Bode is a dense, populated Swan, with fainter stars filling the wings that neither Bayer nor Flamsteed had bothered to render.
Density is what makes Bode interesting and what makes Bode difficult. On the bright Cygnus stars — the ones Flamsteed had already placed well — Bode's positions are comparable, sometimes marginally better. On the newly added faint stars, positional quality is uneven: some drawn directly from Lacaille's or Herschel's tables sit within an arcminute or two of truth; others, interpolated between reference stars during engraving, drift into ten-arcminute territory. The atlas is at its worst when it tries to be at its most complete. This is not a failing peculiar to Bode. It is what happens when a chartmaker outruns the underlying catalogue: the density of the plot exceeds the precision of the data.
Deneb As Anchor: One Star, Three Positions
Every accuracy test needs an anchor. Deneb — the tail of the Swan, the northern vertex of the Summer Triangle — was ours. It is unmissable on all three atlases, unambiguously labelled or positioned, and bright enough that no engraver needed to squint. If the test broke on Deneb, the test would be worthless.
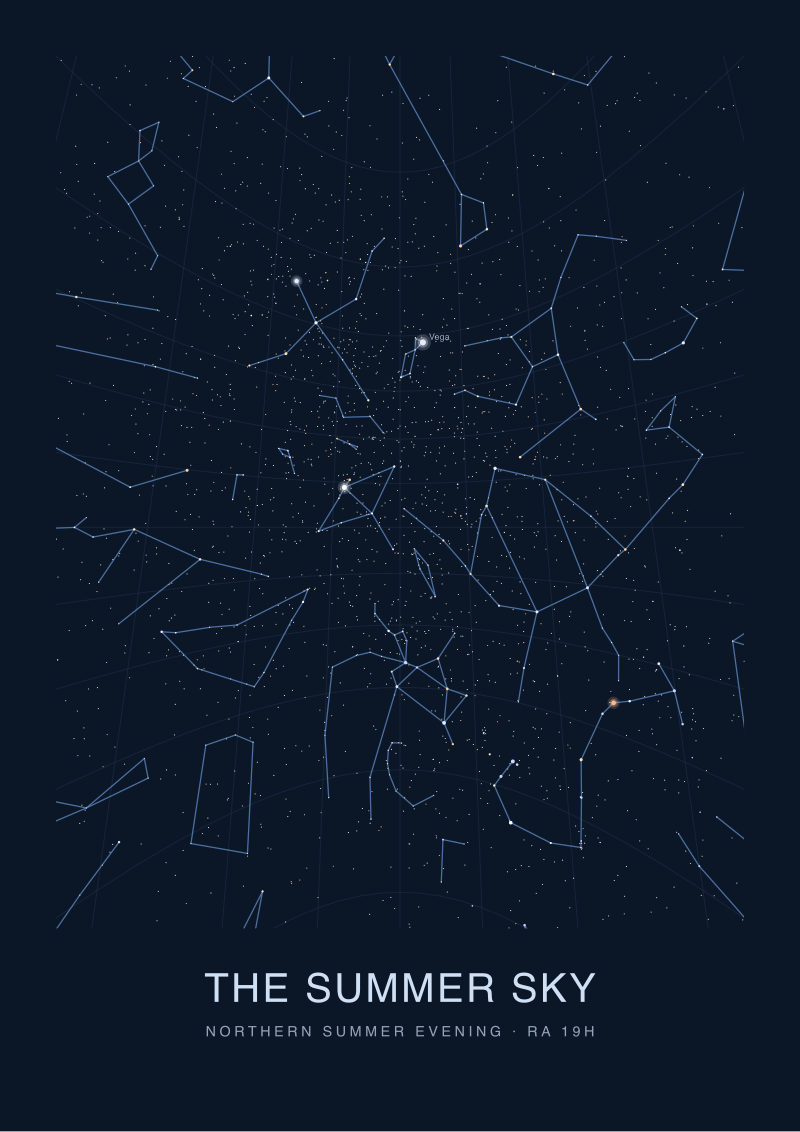
It did not break. Bayer's Deneb precessed forward to J2000 lands roughly half a degree from the modern position, consistent with the bulk drift on his other bright Cygnus stars. Flamsteed's Deneb closes that gap by a factor of ten or so, sitting a few arcminutes off. Bode's Deneb is comparable to Flamsteed's, within the same few-arcminute band. The three-chart trajectory for a single star is the trajectory of the craft: naked-eye workshop, telescopic observatory, mature compilation. Deneb also gives us a useful triangulation to a star that is in our grounding catalogue: Vega, at right ascension 18.6156 hours and declination +38.78 degrees, sits due south-west of Deneb in the summer sky, and its position anchors the coordinate frame all three atlases were trying to render.
 The Summer Sky
The print from this article · from €29.95
View the print →
The Summer Sky
The print from this article · from €29.95
View the print →
The Neck Of The Swan: Where All Three Charts Disagree
The interesting anomaly is not a bright star. It is the region between the chest and the head — the neck of the Swan, running roughly from the crossing star down toward the beak. On the neck, all three atlases disagree with each other, and all three disagree with modern coordinates by more than they should.
The reason is optical, and it is human. The neck is a stretch of moderately bright stars in an extremely rich Milky Way field. On a naked-eye chart, the neck star can drift because the observer confuses it with a neighbour of similar brightness. On a telescopic chart, the neck star can drift because the field is so crowded that the reference frame around it becomes ambiguous. On a compilation chart, both errors can compound: Bode inherits Flamsteed's neck, corrects it partially against his own reductions, and ends up with a neck whose stars sit in a different place than Bayer's or Flamsteed's, and none of them exactly where the neck actually is.
The neck of the Swan is not a failure of any single cartographer. It is a failure of the region — a place where the sky itself resists being drawn cleanly, and where every century of the craft has left its own small displacement.
What The Drift Actually Measures
An accuracy test on old charts is really a test of everything upstream of the chart: the observing instrument, the reference frame, the reduction pipeline, the engraver's registration, the paper's shrinkage after printing. Every arcminute of drift is a fingerprint of one of those steps.
Bayer's drift is the fingerprint of a naked-eye catalogue passed to an engraver. Flamsteed's drift is the fingerprint of telescopic astrometry compressed onto copper. Bode's drift is the fingerprint of a compilation atlas: brilliant where its sources were, weaker where it interpolated beyond them. None of the three is a bad chart. All of them are honest about the era of instrumentation they came from, once you know how to read the offsets.
What the test does not measure: the artistic decision to draw the Swan flying with its neck outstretched, the choice of which stars to label with Greek letters versus numbers, the political geography of who dedicated which plate to which patron. Those decisions matter for the history of the object as a printed book. They do not move a coordinate. That is the point of separating the two questions — and the reason we plot before we draw.
FAQ
Why compare only Cygnus and not multiple constellations?
Cygnus is a controlled test bed. It straddles the Milky Way with several unambiguous bright stars, it appears prominently on all three atlases we chose, and its shape is distinctive enough that no engraver mislabelled its principal stars. A broader comparison across many constellations would multiply variables — different plate registrations, different reference stars, different sky regions with different densities — and dilute the signal. A single well-chosen constellation gives you a clean fingerprint of each atlas's positional pipeline.
Are the drift numbers you describe published anywhere?
Our numbers are internal measurements taken for this piece. Positional analyses of Uranometria, Atlas Coelestis and Uranographia have been done in the academic literature — comparisons of Tycho's catalogue against modern positions are especially well studied — and our directional conclusions match that literature. We do not publish the raw per-star offsets here because the readable output is the shape of the drift, not a table of arcminute values whose measurement depends on which plate copy you scan.
Does precession make old charts look worse than they were?
It would, if we did not correct for it. Every historical position is stated in the epoch of the atlas — Bayer in an early seventeenth-century frame, Flamsteed in an early eighteenth-century frame, Bode near 1800. Comparing those directly to J2000 without precessing forward would add fifty degrees of apparent drift over the full baseline, none of it the cartographer's fault. We precess each atlas position to J2000 first, then measure. What remains is the chart's own error.
Which of the three is the best chart to actually use today?
None of them, for practical stargazing. For that, use a modern catalogue or planetarium software. As historical objects, Flamsteed's Atlas Coelestis is the closest to modern positional accuracy on the stars it covers; Bode's Uranographia is the richest and the most visually ambitious; Bayer's Uranometria is the founding document of the Greek-letter naming system every later chart inherited. Each answers a different question. Positional accuracy is only one of them.
Where does Vega fit in this comparison?
Vega sits in Lyra, immediately south-west of Cygnus in the summer sky, and it appears on all three atlases as a bright anchor at the edge of our test region. Its modern HYG coordinates — right ascension 18.6156 hours, declination +38.78 degrees — gave us a stable adjacent reference point to check that our precession pipeline was behaving correctly before we measured Deneb and the rest of the Cygnus stars. When Vega precessed forward matches Vega today, the machinery is trustworthy.
Can I see prints of the Cygnus region we tested?
Our studio's Cygnus and Summer Triangle prints are drawn from modern HYG data, plotted at studio scale before any illustrative treatment is added — the same plot-before-draw discipline that made this comparison possible. Available at /shop/. We do not sell reproductions of the historical atlases themselves; for those, museum and library digitisations are the honest route, and most are freely accessible online.
From the collection
New charts and 10% off your first print.
One email now with your code. No noise after.