There is a pattern we see, week after week, in the requests that come across the studio's desk: parents ask for a star chart for a child's wall, and almost none of them ask which sky. They ask for something pretty, something educational, something that will "spark curiosity". What they rarely ask is whether the map shows the sky the child can actually walk outside and see, or a sky belonging to another hemisphere entirely. A star chart is a document about a specific place on Earth. That is the first fact worth teaching a child, and the first fact most wall prints quietly get wrong.
The Pattern of Parents Who Ask for the Wrong Sky
The request usually arrives with a mood attached to it. Someone wants a chart that feels magical, or dreamy, or that matches a nursery in muted blues. The child is four, or seven, or eleven, and about to become interested in something the parent hopes will last. The map, in the parent's imagination, is a decoration first and a document second. This inversion is where almost every purchasing mistake begins.
A star chart is not wallpaper with dots. It is a projection of a real sphere onto a flat surface, at a chosen date, from a chosen latitude, oriented to a chosen horizon. Change any of those variables and the map changes. A chart plotted for London in January will not describe the sky above Melbourne in July in any meaningful sense; the constellations that dominate one are absent from the other, and the ones that appear in both stand upside down relative to each other. When a child looks up from their garden and cannot find the shape that is glowing on their bedroom wall, the map has failed at its first job, which is to be true.
The second pattern we see is the request for a chart that shows "all the constellations". There are eighty-eight of them, formally recognised by the International Astronomical Union since 1930, and no observer at any single latitude will ever see all of them from their own soil. A viewer at 40 degrees north cannot see the Southern Cross without travelling; a viewer at 40 degrees south cannot see the Big Dipper. A chart that promises the whole sky is either two hemispheres pressed onto one page, which produces a beautiful but geographically incoherent document, or a planisphere, which is a rotating disc rather than a static print. Both are legitimate objects. Neither is what most parents actually mean when they ask for a star map for the bedroom.
The third pattern is more subtle. Parents ask for a chart with the child's birthday on it, treating the sky as a personal artefact. This is the point at which the studio has to be careful. A dated sky chart is a real cartographic object — it computes the positions of stars, planets and the Moon for a specific moment, from a specific latitude — and it is a fine gift if that is what is being requested. It is not, however, an astrological chart, and the zodiac signs that decorate so many commercial "birthday sky" prints are a coordinate band along the ecliptic, not a personality system. If a child is going to grow up reading their wall, better that the wall tell the truth about what it is showing.
The Six Stars That Should Anchor Any Child's Chart
If you take the whole night sky and rank it by apparent magnitude — the scale astronomers use to measure how bright a star appears from Earth, running counterintuitively so that lower numbers mean brighter objects — a handful of stars sit so far ahead of the pack that they organise the entire visible sky between them. Any wall chart intended for a child should render these six stars unambiguously, at a size and weight that reflects their real dominance. If the map treats them as equal to the thousand fainter stars around them, it is a decorative print, not a chart.
The brightest is Sirius, in the constellation Canis Major, at apparent magnitude -1.44. It sits at a declination of about -16.7 degrees, which places it just south of the celestial equator, which in turn means it is visible from almost anywhere a child on Earth is likely to sleep. Sirius rises with Orion in the winter evenings of the northern hemisphere and the summer evenings of the southern one, and it is the star a parent can most reliably point to and say, "that one, the very bright one, that is on your map." This is the entry point. Every subsequent star the child learns is anchored to Sirius.
Canopus, in Carina, is the second brightest at magnitude -0.62, but it sits at declination -52.7 degrees. A child living in Sydney, Cape Town or Buenos Aires will see Canopus dominate their winter skies. A child living in Berlin or Toronto will never see it at all. This is precisely the sort of star that betrays a mis-chosen chart: if the map has Canopus glowing on the wall and the family lives in the northern temperate zone, the map is a document about somewhere else.
Arcturus, in Bo\u00f6tes, follows at magnitude -0.05, at declination +19.2 degrees — a northern star, high in spring and summer evenings for most of the populated world. Rigil Kentaurus, in Centaurus, sits at magnitude -0.01 but at declination -60.8 degrees, deeply southern and unreachable from most of the northern hemisphere. Vega, in Lyra, at magnitude 0.03 and declination +38.8 degrees, is one of the three points of the Summer Triangle familiar to any northern observer. Capella, in Auriga, at magnitude 0.08 and declination +46.0 degrees, is a northern circumpolar star for much of Europe and Canada — it never sets.
Six stars, six magnitudes clustered between -1.44 and 0.08, spread across declinations from -60.8 to +46.0 degrees. That spread is the whole argument. Three of these stars belong essentially to the north (Arcturus, Vega, Capella), two belong essentially to the south (Canopus, Rigil Kentaurus), and one belongs to both (Sirius). Any chart for a child's wall should render at least four of them at a size the eye recognises immediately, and the four should be the four the child can actually see from their own latitude.
A star chart that treats a magnitude -1.44 star and a magnitude +5 star as the same-size dot is not a map of the sky; it is a pattern of confetti.
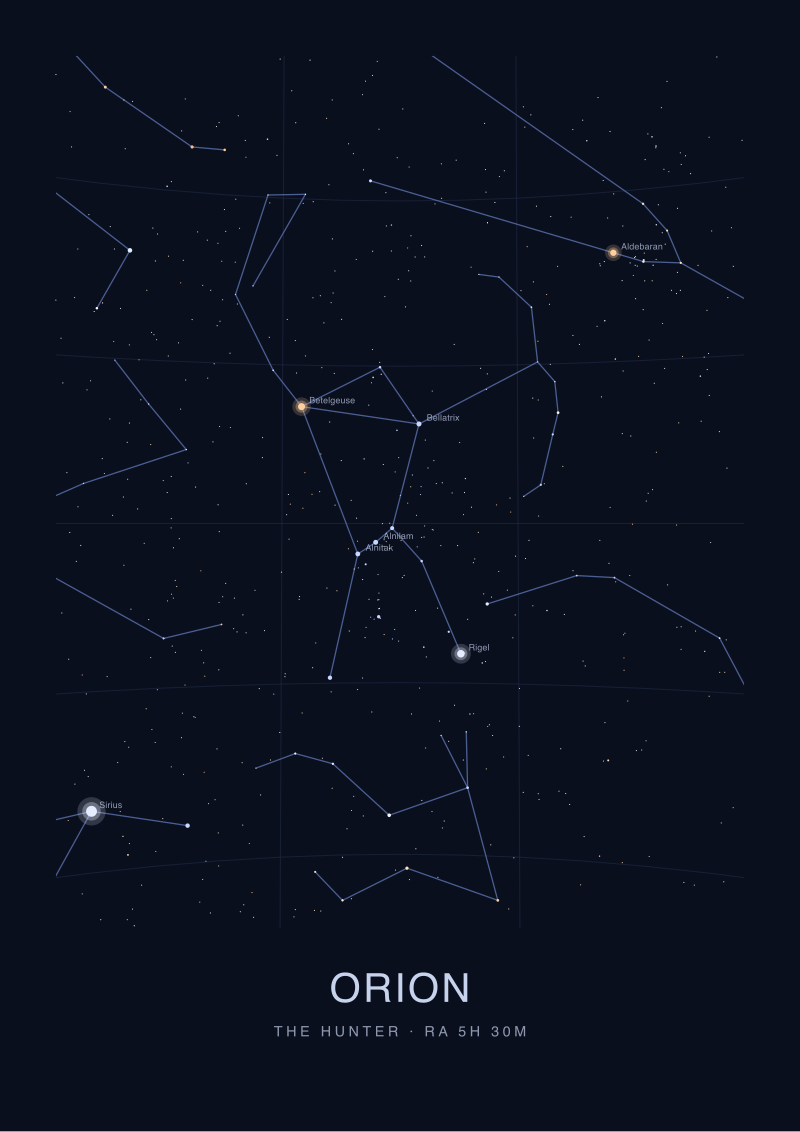 Orion
The print from this article · from €29.95
View the print →
Orion
The print from this article · from €29.95
View the print →
The Hemisphere Question Nobody Asks First
Ask a parent buying a chart which hemisphere they live in and they will look at you as if the question were rude. Everyone knows which hemisphere they live in. But the question is not really about geography — it is about which sky the map is going to describe, and here the answers get surprising. A family in southern Spain and a family in southern Chile are separated by roughly eighty degrees of latitude. The stars that pass overhead in each are almost entirely different populations. And yet the same generic "starry night" print, mass-produced and drop-shipped, ends up on nurseries in both places, describing neither.
The cleanest way to think about it: your latitude determines your celestial horizon. If you live at 40 degrees north, you can see stars from declination +90 (the north celestial pole, permanently overhead-ish) all the way down to declination -50 (which briefly grazes your southern horizon on certain nights). Anything south of declination -50 is invisible to you, forever, without travel. This is why Rigil Kentaurus, at declination -60.8, never appears in a Parisian sky. It is also why Capella, at declination +46.0, essentially never sets for an observer in Edinburgh — it just circles the pole through the night.
For a child, this is one of the loveliest facts astronomy can offer, and a good wall chart teaches it silently. A chart plotted honestly for the family's latitude will have a horizon line, a zenith marker, and an oval or circular projection that shows what is visible from that specific spot. The stars along the outer edge rise and set; the stars near the centre are overhead; the stars in the polar region never touch the ground. A child who studies such a chart for a year learns, without being told, that the sky is a coordinate system tied to their doorstep.
The commercial alternative — the "world sky" print that fuses the two hemispheres into a single flat rectangle, often with all eighty-eight constellations labelled — is not wrong, exactly. It is a different kind of object: an atlas plate rather than a local map. It has its place, particularly for older children already curious about geography and coordinates. But it is not what to hang above a four-year-old's bed. Above the bed, the map should show the sky the child sees when the curtains open. Anything else is decoration pretending to be instruction.
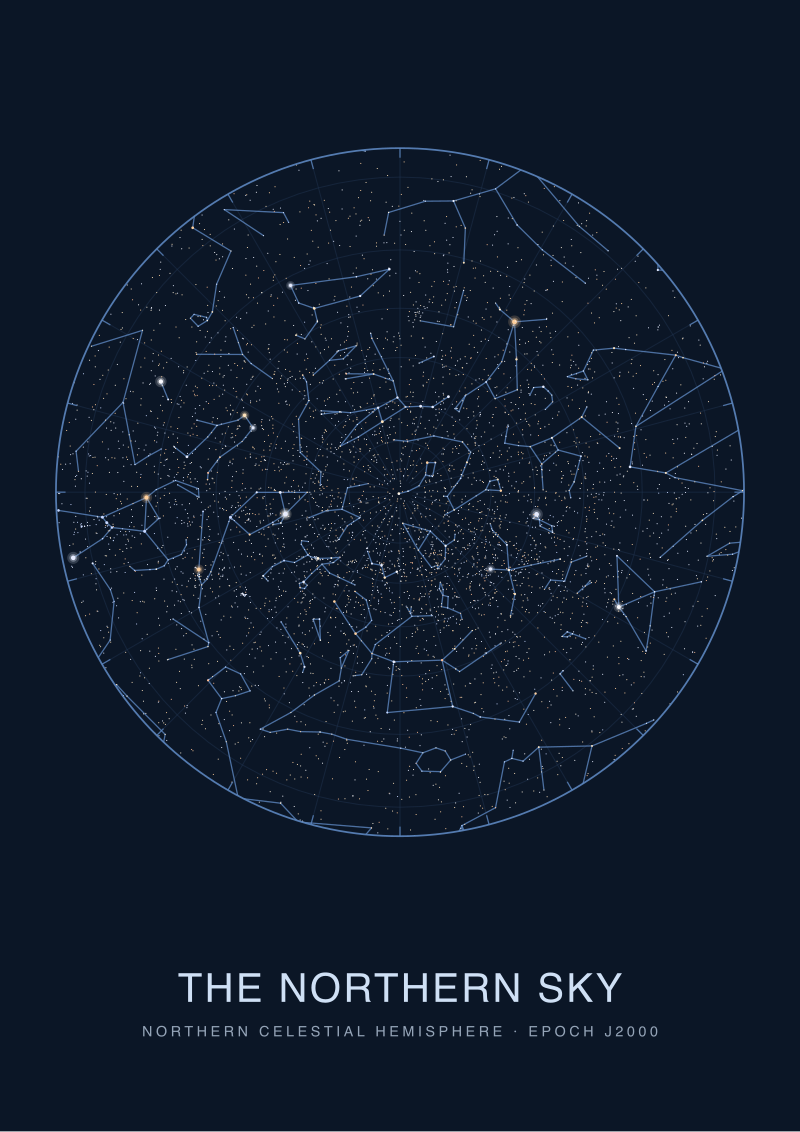
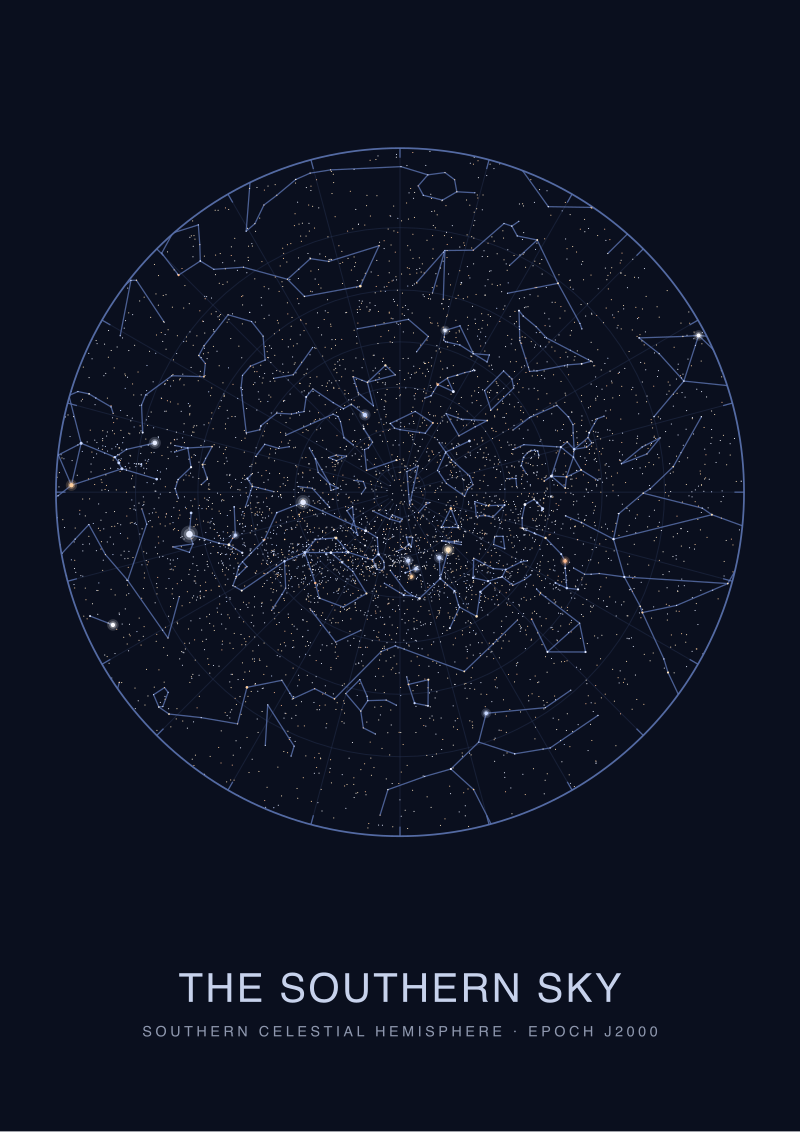
There is a middle path for families who move, or who split time between hemispheres, or who simply want a chart that will remain accurate as the child grows. A pair of hemisphere charts — one northern, one southern — hung as a diptych, avoids the compression problem entirely. Each map is honest about its half. Together they cover the sky as it actually divides. This is the format we most often recommend when parents describe a life that crosses latitudes, and it costs no more than a single oversized "everything" print.
So What Do You Actually Hang Above the Bed
Start with the latitude. Not the country, the latitude — the number that tells you which half of the sky is truly yours. If the child lives between roughly 30 and 55 degrees north, hang a northern hemisphere chart with Vega, Capella and Arcturus rendered at the size their magnitudes deserve, and with Sirius holding the southern edge in winter. If the child lives at equivalent southern latitudes, hang a southern chart anchored by Canopus and Rigil Kentaurus, with Sirius again as the shared bridge. If the family sits near the equator, either chart works — but the southern one usually offers more visual drama, because Rigil Kentaurus and the Southern Cross are simply more compelling to a child's eye than the fainter northern circumpolar constellations.
Then insist on magnitude fidelity. Ask, before buying, whether the print sizes its stars by real apparent magnitude or by decorative preference. The difference is visible at ten paces: a properly plotted chart has six or seven stars that leap off the page, a scatter of moderately bright ones, and a delicate wash of fainter ones. A decorative chart has hundreds of equally weighted dots that read as texture rather than as a map. The first teaches a child to look for Sirius. The second teaches them nothing.
Finally, resist the birthday-sky impulse unless the studio producing it will tell you honestly what it is computing. A real dated star chart calculates the sky over a real place at a real moment, and it will happily show you the maths — the latitude, the local sidereal time, the horizon geometry. If what you are being sold is a zodiac wheel with the child's sun sign highlighted, that is not a star chart; it is jewellery in paper form, and it is not the object being discussed here. A child raised on maps that tell the truth about the sky will eventually notice the difference on their own, and thank you for the years of quiet accuracy above the bed. For families who want a plotted chart made this way, our own see the Orion print prints are drawn from the HYG catalogue at the exact latitude you supply.
FAQ
At what age is a star chart actually useful on a child's wall?
Younger than most people assume. A two-year-old will not read the map, but they will notice which dots are largest and start pointing at "the big one" — which, if the chart is honest, is Sirius at magnitude -1.44. By four or five, a child can match the brightest three or four stars on the wall to what they see through the window on a clear night. The map earns its place through repetition, not through comprehension on day one.
Northern or southern hemisphere chart — how do I decide if I live near the equator?
Between roughly 15 degrees north and 15 degrees south, both hemispheres are visible across the year, so either chart is defensible. We generally lean southern in that band, because Canopus (magnitude -0.62) and Rigil Kentaurus (magnitude -0.01) give the map two spectacular anchors that a northern chart at the same latitude cannot match. If your child is more likely to look south from the bedroom window, that decision is made for you.
Should the chart show constellation figures or just the stars?
Both approaches are legitimate. Figure lines — the mythological drawings connecting the stars — help a young child recognise shapes and remember names, but they can also crowd the page and obscure the underlying geometry. Our own preference is a chart that shows the figures faintly, in a colour that recedes, so the stars themselves remain the primary reading and the myth sits behind them as context rather than as the main event.
Is a "birthday star chart" the same thing as an astrology chart?
No, and the distinction matters. A birthday star chart, done properly, computes the actual position of stars, planets and the Moon above a specific location at a specific moment — real cartography, real astronomy. An astrology chart uses the same date but interprets it through the zodiac as a personality system, which the studio treats as outside the discipline. If a print blends the two, ask the seller to separate them. The astronomy stands on its own.
Why does the magnitude scale run backwards, with negative numbers for the brightest stars?
The scale is inherited from Hipparchus, roughly two thousand years old, who ranked visible stars into six classes from brightest ("first magnitude") to faintest ("sixth"). When nineteenth-century astronomers made the scale mathematical, they preserved the direction, which meant stars brighter than Hipparchus's first class had to receive smaller and eventually negative numbers. Sirius at -1.44 is not "minus bright"; it is simply brighter than the scale's original ceiling.
How many stars should actually appear on a child's chart?
Fewer than you think. A chart plotted to magnitude 4 or 4.5 will show roughly the stars a child can see from a suburban garden on a good night — several hundred, not several thousand. Going deeper than magnitude 5 produces a beautiful map for a dark-sky observer but a confusing one for a child in a lit neighbourhood, because most of the printed stars will never be visible from where they actually stand.
Do the stars on the chart move over the child's lifetime?
The stars themselves move imperceptibly on a human timescale, but the sky as a coordinate system drifts because of precession — the slow wobble of Earth's axis over roughly 26,000 years. Practically, a chart printed today will remain accurate to the eye for the whole of a child's life. Polaris will still mark north when they are eighty. What changes noticeably is the position of planets and the Moon, which is why dated charts show a specific night rather than a general sky.
What size print actually works above a bed?
Large enough that the six brightest stars are readable from across the room. In practice this means at least 50 by 70 centimetres for a single-hemisphere chart, and larger if the figures and constellation names are to be legible at reading distance. A print too small collapses the magnitude hierarchy back into confetti, which defeats the entire point of choosing a chart plotted by real brightness.
From the collection
New charts and 10% off your first print.
One email now with your code. No noise after.