We have read most of the standard accounts of celestial cartography — the ones that march from Dunhuang to Ptolemy to Bayer to Flamsteed, pause politely at Uranometria, nod at Bode, and end with a photograph of the Palomar plates. They all miss the same things, and they miss them in the same order. The maps in these histories are treated as pictures. They were not pictures. They were computations, made against a sky whose brightest anchors — Sirius at magnitude −1.44, Canopus at −0.62, Arcturus at −0.05 — have been the same load-bearing points for every atlas ever drawn.
What They All Get Wrong
The shared error is aesthetic. The standard narrative treats a star atlas as an illustrated book whose value is graphic — the swirl of engraved lines around a bear, the gilded border of a planisphere, the calligraphic label on a Persian celestial globe. This framing turns the history of celestial cartography into a history of taste. Renaissance atlases become "more beautiful" than their medieval predecessors. Nineteenth-century atlases become "more scientific". The book you are reading probably contains the sentence "art meets science" somewhere in its introduction, and the sentence is doing no work.
An atlas of the sky is not a picture of the sky. It is a coordinate transform between a catalogue and a page. The engraver draws around numbers that were computed in advance: right ascension, declination, magnitude, and — from the eighteenth century onward — proper motion. When Johann Bayer assigned Greek letters to the stars of each constellation in the 1603 Uranometria, he was not choosing his favourites. He was building an index, roughly ordered by brightness, so that a reader who saw a star of a certain magnitude in a certain constellation could look up the corresponding Greek letter without ambiguity. Alpha Canis Majoris is Sirius because Sirius, at magnitude −1.44, is the brightest star in Canis Major. Alpha Boötis is Arcturus because Arcturus, at magnitude −0.05, dominates Boötes. The letters are a search key. Most histories describe them as a design choice.
The second half of the aesthetic error is worse. Popular histories tend to describe pre-telescopic atlases as "less accurate" than telescopic ones, as if accuracy were the point. Ptolemy's star list, preserved through the Almagest and copied for a thousand years, carried positions good to roughly a sixth of a degree — better than the eye can resolve two adjacent stars — and its magnitudes, on the ordinal scale it invented, still map cleanly onto modern values for its brightest entries. The atlases that inherited it were not trying to be photographs. They were trying to be lookup tables that a navigator could hold at arm's length under a lamp. The lamp is part of the object.
A working chartmaker reads a historical atlas the way a cartographer reads a portolan: what projection, what epoch, what catalogue, what tolerance. Nobody in the standard histories tells you the projection. Nobody tells you the epoch. Nobody tells you which catalogue the engraver was working from, or how the catalogue's magnitudes were rounded before the burin touched the plate. The pictures get the paragraphs. The computation gets a caption.
What Is Almost Always Missing
Three things are almost always missing, and they compound.
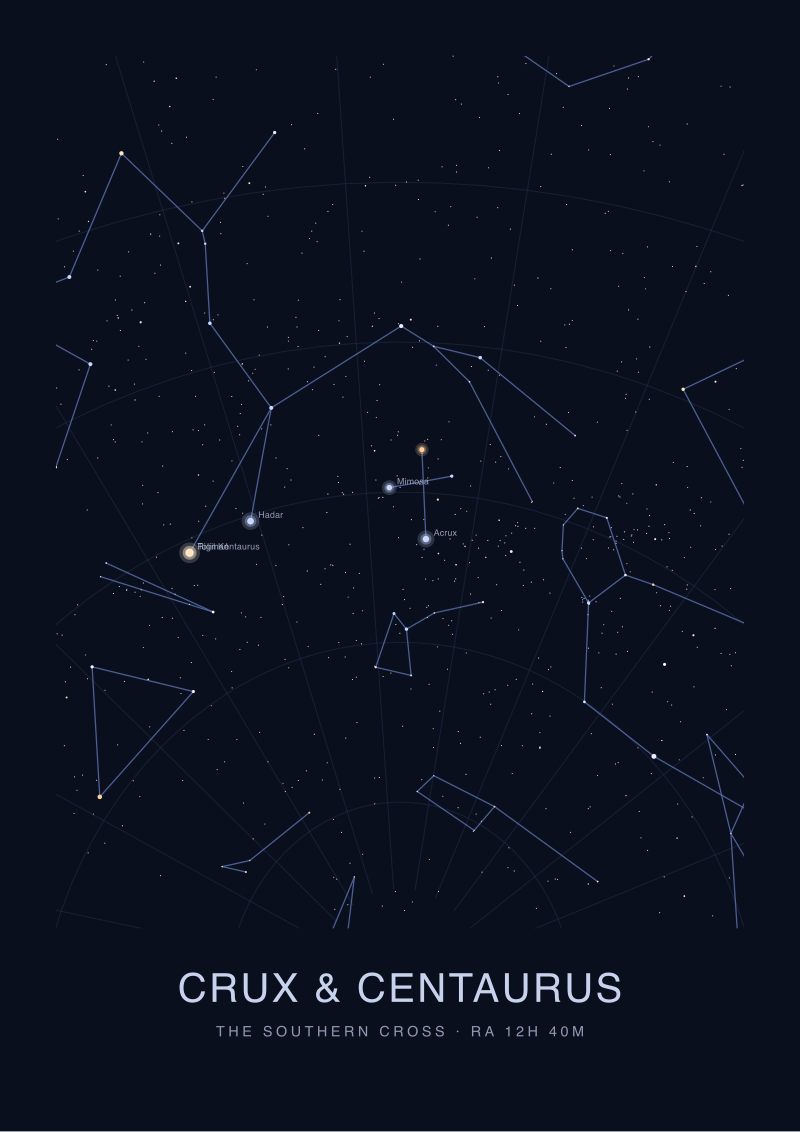
The first is the southern sky. The standard narrative is a northern-hemisphere narrative, told through observers who could not see the southern circumpolar cap. Canopus, at declination −52.7°, and Rigil Kentaurus, at −60.8°, are the second and fourth brightest stars in the entire sky — magnitude −0.62 and −0.01 respectively — and both are structurally invisible from Alexandria, Baghdad, Nuremberg or Paris. For most of celestial cartography's history, the two brightest anchors of the southern hemisphere are simply absent from the maps that shaped the European record. When they enter, in the late sixteenth century through the voyages of Keyser and de Houtman, they enter as a data dump: a catalogue of southern stars appended to a northern atlas, drawn with less care because the engravers had never seen them. The histories tend to skip this. The southern sky arrives, and the narrative moves on. The fact that half of the celestial sphere has a shorter cartographic record than the other half is treated as an accident of geography rather than the central asymmetry of the field.
The second missing thing is labor. Every position in a star atlas was measured by somebody, using an instrument built by somebody else, calibrated against a clock corrected by somebody else again. The Flamsteed catalogue that underwrites much of eighteenth-century cartography represents roughly forty years of night work at Greenwich; the reductions were done in part by his assistants and, after his death, over his family's objection. Argelander's Bonner Durchmusterung, which extended star mapping down to ninth magnitude across the northern sky, took a team more than a decade of nightly observation. The Cape Photographic Durchmusterung did the same for the south. Histories that focus on the engravers and the publishers erase the observers, the computers — a job title, in the nineteenth-century sense — and the assistants whose hands did the arithmetic that made the plates possible.
The third missing thing is epoch. A star atlas is a snapshot of a coordinate system at a moment. Because of precession, the coordinate grid itself rotates against the fixed stars at roughly one degree every seventy-two years, which means every atlas has an expiry date printed invisibly on its face. Vega, magnitude 0.03, sat within a few degrees of the celestial pole around 12,000 BCE and will sit near it again around 13,700 CE; today it is 51 degrees away. Capella, magnitude 0.08, was a spring star for the ancient Greeks and is a winter star for us. An atlas dated to epoch 1875.0 is not directly usable in 2026 without a precession correction, and the histories that reprint these plates as decorative artifacts rarely mention this. The map is legible. It is just legible to a slightly different sky.
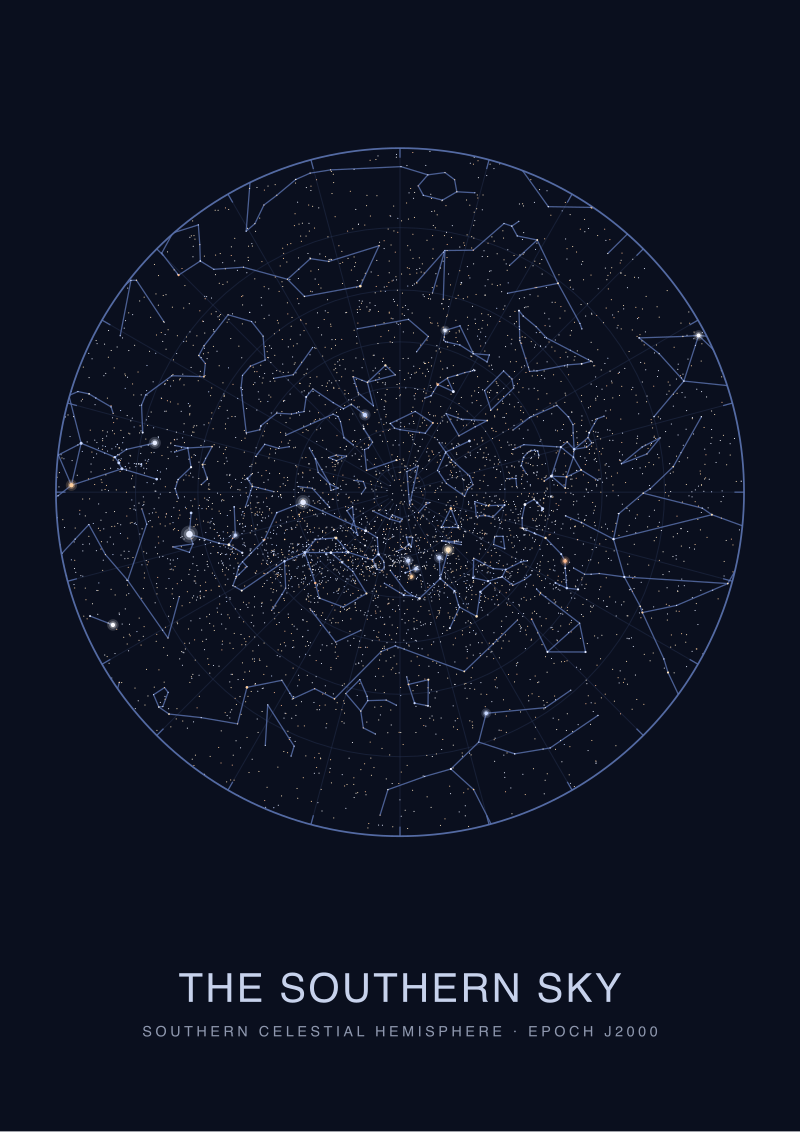 The Southern Sky
The print from this article · from €29.95
View the print →
The Southern Sky
The print from this article · from €29.95
View the print →
What I Would Say Instead
An atlas of the sky is a coordinate transform, brightness-weighted, epoch-stamped, made by hands you can name if you look. That is the sentence the histories will not write, and it is the sentence a working chartmaker starts every project with.
Start with the brightness weighting. The eye does not see the sky uniformly; it sees a small number of anchors and infers the rest. Six stars carry a disproportionate share of the load in any hemisphere-scale composition: Sirius (−1.44), Canopus (−0.62), Arcturus (−0.05), Rigil Kentaurus (−0.01), Vega (0.03), Capella (0.08). Every atlas ever printed has had to decide how to render these six against everything else. Bayer's solution — alpha for the brightest in each constellation, then beta, gamma, delta — is a brightness-weighted index that still functions today, four centuries after the plate was cut, because the underlying magnitudes have not meaningfully changed. Flamsteed's numbered scheme adds a positional index within each constellation, running west to east in right ascension. The two systems coexist because they answer different queries: Bayer answers "which star is brightest here", Flamsteed answers "which star is next along the arc". A history of celestial cartography that does not explain this is a history of the covers of the books, not the books.
Now the epoch. Every atlas states, or should state, the year to which its coordinates are referred: J2000.0 in modern practice, 1875.0 in the era of the Bonner Durchmusterung, 1690 for Hevelius's Firmamentum Sobiescianum, and so on. The atlas is a photograph of the celestial coordinate grid at that instant. Read it correctly and you can transform any historical star position into today's grid using a precession model that has been stable, to well within engraver's tolerance, for two centuries. Read it as a picture and you will believe that Ptolemy's Alpha Draconis was "wrong" because it does not match your planetarium software — when in fact it was correct for its epoch and your software has silently reprojected everything to J2000.0 without telling you.
And then the labor. Naming the observers matters not for sentiment but for triangulation. When two atlases disagree on a magnitude, the disagreement is almost always traceable to two different observers using two different instruments on two different nights, and knowing who did which measurement is the only way to resolve it. Caroline Herschel's revisions to Flamsteed. The Harvard computers, largely women, whose plate analyses fixed the magnitude scale in the early twentieth century. The unnamed Persian and Arabic-speaking astronomers whose star names — Rigil, Vega, Capella's older forms — arrive in modern catalogues stripped of their transmission history. A serious account of celestial cartography carries these names because the atlases carry their measurements.
This piece does not cover the transition to photographic astrometry after 1887 in any technical depth — the story of the Carte du Ciel deserves its own account and would double the length of this one. It does not address the digital atlases, from HYG to Gaia DR3, whose data underwrite every star chart printed today, including ours. And it does not attempt a full accounting of the Chinese, Indian, and Mesoamerican cartographic traditions, each of which had its own coordinate systems, its own anchor stars, and its own unbroken labor of observation; treating them as footnotes to a European lineage is the fourth error, and we have not solved it here either.
FAQ
What is the oldest surviving star atlas?
The Dunhuang star chart, held at the British Library, dates to around 700 CE and shows roughly 1,300 stars in twelve panels plus a north polar plot. It is not the oldest star map ever made — Babylonian tablets, Egyptian ceiling reliefs, and Ptolemy's earlier positional catalogue all precede it — but it is the oldest surviving artefact that behaves like an atlas in the modern sense: a systematic, coordinate-organised graphical record of the observable sky, drawn to be consulted rather than admired.
Why do star atlases use Greek letters for star names?
The Greek-letter scheme comes from Johann Bayer's 1603 Uranometria. Within each constellation, Bayer assigned alpha to the brightest star, beta to the next, and so on. It is a compact search key: given a constellation and a magnitude, a reader can identify a star without ambiguity. Alpha Canis Majoris is Sirius because Sirius (magnitude −1.44) dominates Canis Major. The scheme is not strictly ordered — Bayer sometimes grouped stars by position within a constellation figure — but it functions as an index four centuries later.
Why are magnitudes negative for the brightest stars?
Because Hipparchus and Ptolemy defined the scale before anyone knew stars could be brighter than the ones they were looking at. The ancients divided visible stars into six magnitude classes, first being brightest. When nineteenth-century astronomers formalised the scale mathematically and calibrated it against Vega (magnitude 0.03), stars brighter than Vega had to be pushed below zero. Sirius sits at −1.44, Canopus at −0.62, Arcturus at −0.05. The scale runs backwards not by design but by inheritance.
How does precession affect old star atlases?
Precession is the slow wobble of Earth's rotational axis, completing a full circuit roughly every 26,000 years. It causes the celestial coordinate grid to rotate against the fixed stars at about one degree every 72 years. An atlas plotted for epoch 1690 is offset from a 2026 sky by roughly 4.7 degrees of arc — small enough that constellations remain recognisable, large enough that precise positions require a coordinate transform before use.
Which stars appear in almost every historical star atlas?
The six anchors of naked-eye astronomy: Sirius (−1.44) in Canis Major, Canopus (−0.62) in Carina, Arcturus (−0.05) in Boötes, Rigil Kentaurus (−0.01) in Centaurus, Vega (0.03) in Lyra, and Capella (0.08) in Auriga. Any atlas covering the relevant declination band shows them, labels them prominently, and often uses them as reference points against which nearby fainter stars are positioned.
Why is the southern sky underrepresented in the history of star atlases?
Because the observers who wrote the dominant historical record — Greek, Arabic, Persian, and European — could not see it. Canopus at declination −52.7° and Rigil Kentaurus at −60.8° are invisible from any latitude much north of the Mediterranean. The southern circumpolar sky enters European cartography only in the late sixteenth century, through the voyages of Pieter Dirkszoon Keyser and Frederick de Houtman, and is treated as an addendum to northern atlases for the next two hundred years.
Are old star atlases still usable for observing today?
Yes, with a precession correction. The bright stars have not moved appreciably against each other in human timescales — proper motion for most naked-eye stars is measured in fractions of an arcsecond per year — so an atlas from 1690 or 1875 still shows the constellations you will see tonight, in the same relative positions. What has changed is the coordinate grid the atlas is plotted against. Applying the precession offset for the atlas's epoch transforms its positions into today's grid.
Where can I see the celestial cartography we plot at Sky Atlas?
Our current star map prints are catalogued at see the The Southern Sky print. Each print is plotted from the HYG catalogue at epoch J2000.0, referenced to the sky as it actually looks from the latitude and date the buyer specifies, with magnitudes preserved to two decimal places so the brightness weighting of the composition matches what the eye will find overhead.
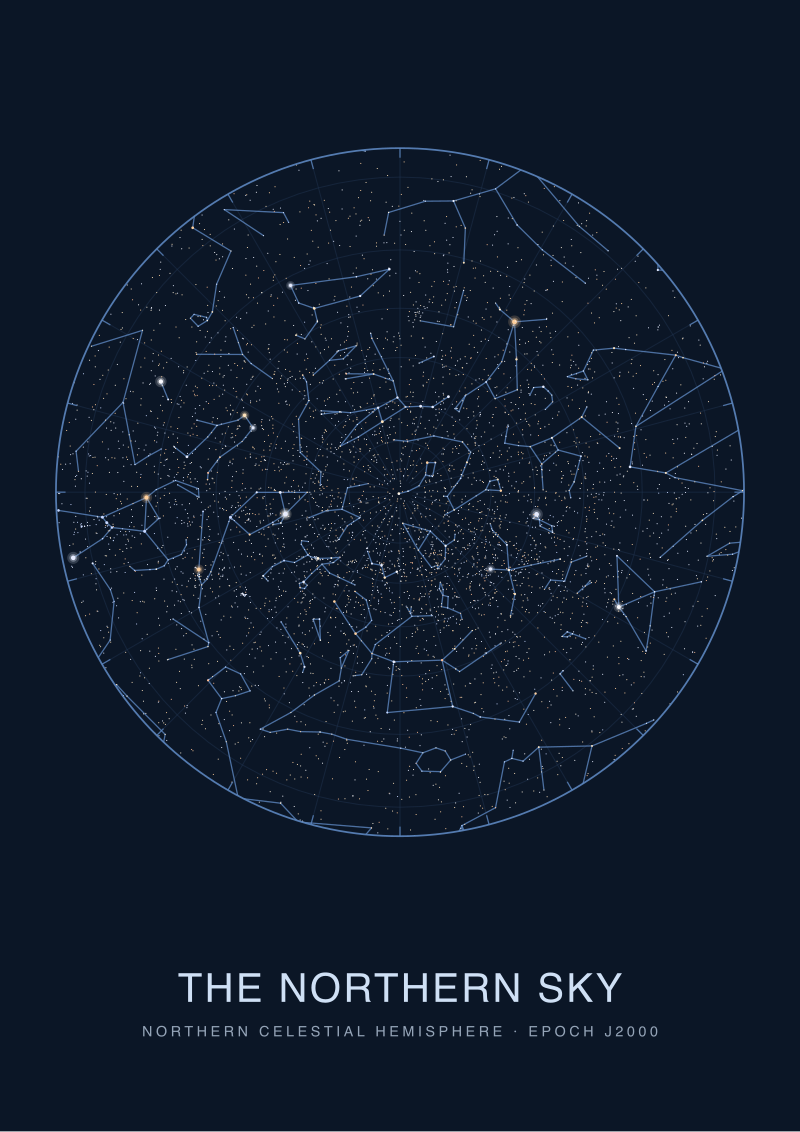 The Northern Sky
The print from this article · from €29.95
View the print →
The Northern Sky
The print from this article · from €29.95
View the print →
From the collection
New charts and 10% off your first print.
One email now with your code. No noise after.