Six of the brightest stars visible from Earth — Sirius, Canopus, Arcturus, Rigil Kentaurus, Vega, and Capella — span a surface-temperature range of roughly 5,500 kelvin, from about 4,300 K at the cool end to about 9,900 K at the hot end. That single number, 5,500 degrees of spread, accounts for every color a naked eye can pick out from the night sky without a filter or a telescope. Blue-white at the top of the scale, white in the middle, yellow-white and warm-white lower down, orange near the bottom. There is no red on this list, because no first-magnitude red star happens to sit in this particular six.
Decompose the range and it does something specific. Sirius, magnitude −1.44 in Canis Major, holds the hot end and reads as the blue-white beacon over a February midnight. Vega, magnitude 0.03 in Lyra, sits close behind at a nearly identical temperature and burns the same shade above a July garden. Canopus, magnitude −0.62 in Carina, cools into the yellow-white band and dominates southern-hemisphere winter. Rigil Kentaurus in Centaurus, magnitude −0.01, sits close to the Sun in temperature and reads warm-white to anyone south of about latitude twenty north. Capella in Auriga, magnitude 0.08, drops further and looks yellow. Arcturus in Boötes, magnitude −0.05, is the coolest of the six and is unmistakably orange to any observer standing under a dark spring sky.
This is not decoration and it is not metaphor. Color is temperature. The mapping is one-to-one, established by more than a century of stellar spectroscopy, and it obeys a physical law — hotter surfaces radiate more of their energy at shorter wavelengths, cooler surfaces at longer ones. And yet if you scroll through wellness apps, "cosmic frequency" YouTube channels, or the newer generation of astrology tools that plug into open star catalogues, you will find the same six-color palette described as a temperament chart. Blue for spiritual, orange for grounded, yellow for creative. That is the pattern we keep tracking on this desk, and it is what this piece is about.
The Warmth Fallacy
There is a pattern that shows up in almost every introductory conversation about star color, and it comes from a mismatch between physics and everyday English. In common speech, red is "warm" and blue is "cool." Interior-design catalogues, coffee-shop lighting menus, sunset photography — all of them lean on that convention. So when a reader first learns that Sirius is blue and Arcturus is orange, the intuition arrives backwards: Arcturus must be the hotter one, because orange feels hotter.
The physics is the opposite. A star's continuous spectrum obeys the same rule as a heated iron bar in a workshop. Warm the bar and it glows dull red; keep warming it and it turns orange, then yellow, then white, then blue-white, then blue. Cooler surfaces peak in longer, redder wavelengths; hotter surfaces peak in shorter, bluer ones. Arcturus, at roughly 4,300 K, sits near the temperature of that dull orange bar. Sirius, at roughly 9,900 K, is well past white and into the blue-white regime a metallurgist would associate with a furnace running hard.
This inversion between everyday language and stellar physics is the door through which almost every misconception walks. If you start from the assumption that red equals hot, then a wellness app assigning "fiery passion" to red giants is coherent inside that wrong model. It sounds right to a reader who has not been told that Betelgeuse is cool and Rigel is hot. The scam works because the folk model was wrong first. The desk's rule for anyone learning to read a chart is simple: assume the blue star is the furnace and the orange star is the ember, and you will be correct almost every time.
The Personality Overlay
The second pattern is more deliberate, and it is where naked misconception turns into something closer to editorial fraud. Open a modern astrology or "sky-frequency" app and you will find, alongside the standard zodiac apparatus, a section that ranks your "cosmic signature" by the colors of the brightest stars visible from your latitude on your birthday. Arcturus overhead? You are grounded, ancient, protective. Vega in the west? Creative, inspired, feminine. Sirius rising? Intellectual, incisive, spiritual leadership.
None of this comes from stellar physics. It comes from copying zodiac-style personality frameworks and painting them over a color palette that a public star catalogue supplied for free. The apparent-magnitude figures — Sirius −1.44, Canopus −0.62, Arcturus −0.05, Rigil Kentaurus −0.01, Vega 0.03, Capella 0.08 — are drawn from the same HYG-derived catalogues that we plot maps from. But the astronomical figures in these apps are furniture. They are dressed up as evidence for a claim they cannot support.
The scam works for the same reason most soft-language scams work. Real numbers borrow authority. The reader sees a magnitude, a right-ascension figure, a spectral class letter, and assumes that the personality claim resting on top of that data has been vetted by the same rigor. It has not. The physics tells you the star's temperature. It does not tell you the reader's temperament, and no serious astronomer has ever claimed it does. The desk's editorial position on this is settled: the zodiac is a coordinate band, not a personality system, and star color is a thermometer, not a horoscope.
The color of a star is a thermometer reading, not a horoscope, and the industry that blurs the two is selling temperature data dressed as spiritual counsel.
The Naked-Eye Correction Problem
The third pattern is subtler and it exists even for careful observers. Human color perception at low light levels is poor. Rod cells, which dominate in dark-adapted vision, are effectively color-blind; cone cells, which register color, need more light than most stars provide. The consequence is that only the brightest stars — first magnitude and, at a stretch, second — reveal their color to an unaided eye at all. Below about magnitude 2, most stars look white to most people under most skies.
That threshold explains why the six on this list are almost the only stars where naked-eye color intuition is reliable. Sirius at −1.44 pushes so much light through the cone system that its blue-white register survives even in mediocre sky conditions. Arcturus at −0.05 is bright enough that the orange comes through cleanly on a dark night, and even city observers usually see it. Capella at 0.08 shows its yellow when it is high overhead in a Northern-Hemisphere winter. But atmospheric extinction reddens stars near the horizon — Sirius on a summer dawn can look almost yellow before it climbs — and light pollution washes color out entirely. What the reader thinks they see is not always what a spectrograph would record.
This gap between perception and measurement is a second attack surface. Apps that overlay "star color energy" claims on augmented-reality skies present a saturated, corrected, artificially colored sky that the eye alone can never see. The reader is looking at a rendered palette, not a real one, and being told the palette carries meaning. The correction is not the scam, but the palette becomes the evidence, and the physics quietly drops out of the argument.
The Catalogue Sleight-of-Hand
The fourth pattern is the one an investigative reader should recognize most cleanly, because it uses the exact machinery this desk uses to plot maps. Public star catalogues — HYG, Hipparcos, Gaia — assign every catalogued star a spectral-class letter: O, B, A, F, G, K, M, running from hottest to coolest. Sirius is A1V. Vega is A0V. Canopus is F0. Rigil Kentaurus A is a G-type, close to the Sun. Capella is G-type as well, though the system is a pair of giants. Arcturus is K-type. These letters are the physics doing its job — a compressed record of surface temperature, luminosity class, and spectral features.
The sleight-of-hand is what happens after the letters are copied into the app. The letters become "cosmic keys." O and B stars are "high-frequency" and "spiritual"; F and G are "harmonic" and "loving"; K and M are "grounded" and "ancestral." The mapping is arbitrary, but the catalogue data underneath it is real, and the app confidently displays the real data as proof of the invented framework. That is the pattern that makes this a warning and not a joke. A user who checks the magnitude, checks the spectral class, and finds them accurate concludes that the personality overlay must be accurate too. It is not. It has no relationship to the physics whatsoever; it is a category error dressed as citation.
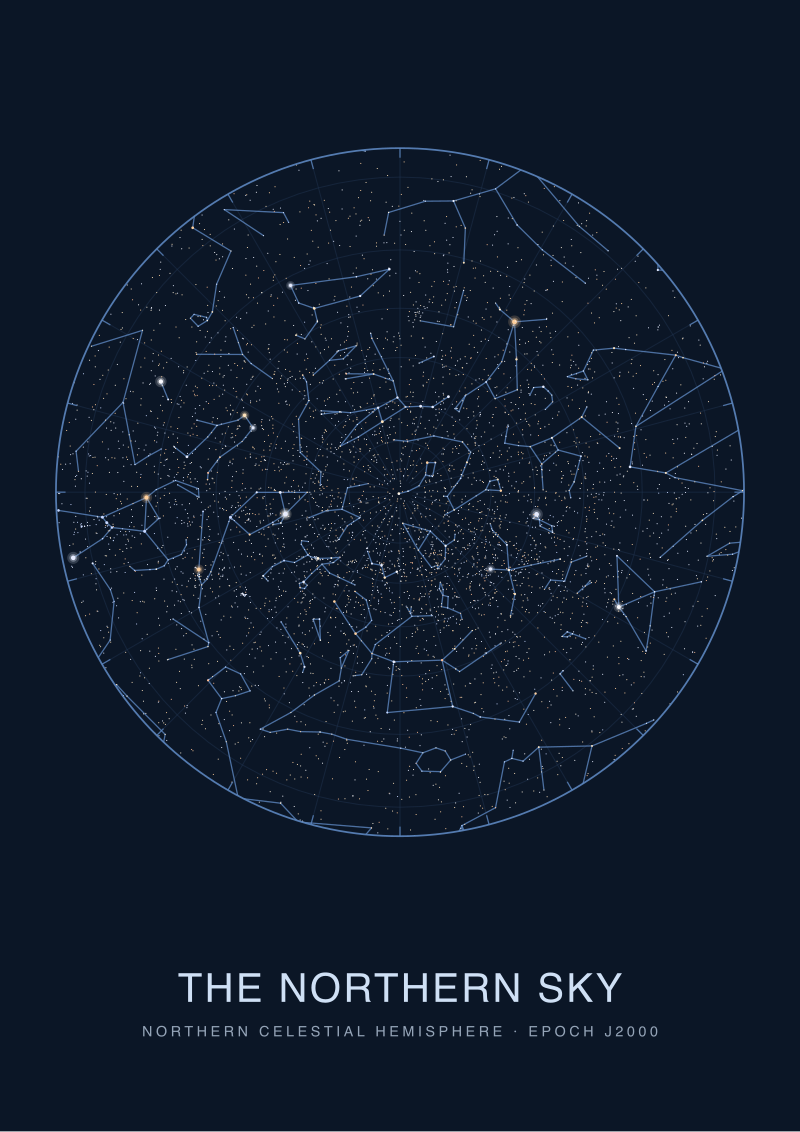
If you plot the same six stars honestly, using the same catalogue rows, what you get is a temperature map of the northern and southern sky between magnitudes −1.5 and 0.1. That is what we print. If you want that map on a wall, we sell it at our shop; it stops where the physics stops and does not tell you who you are.
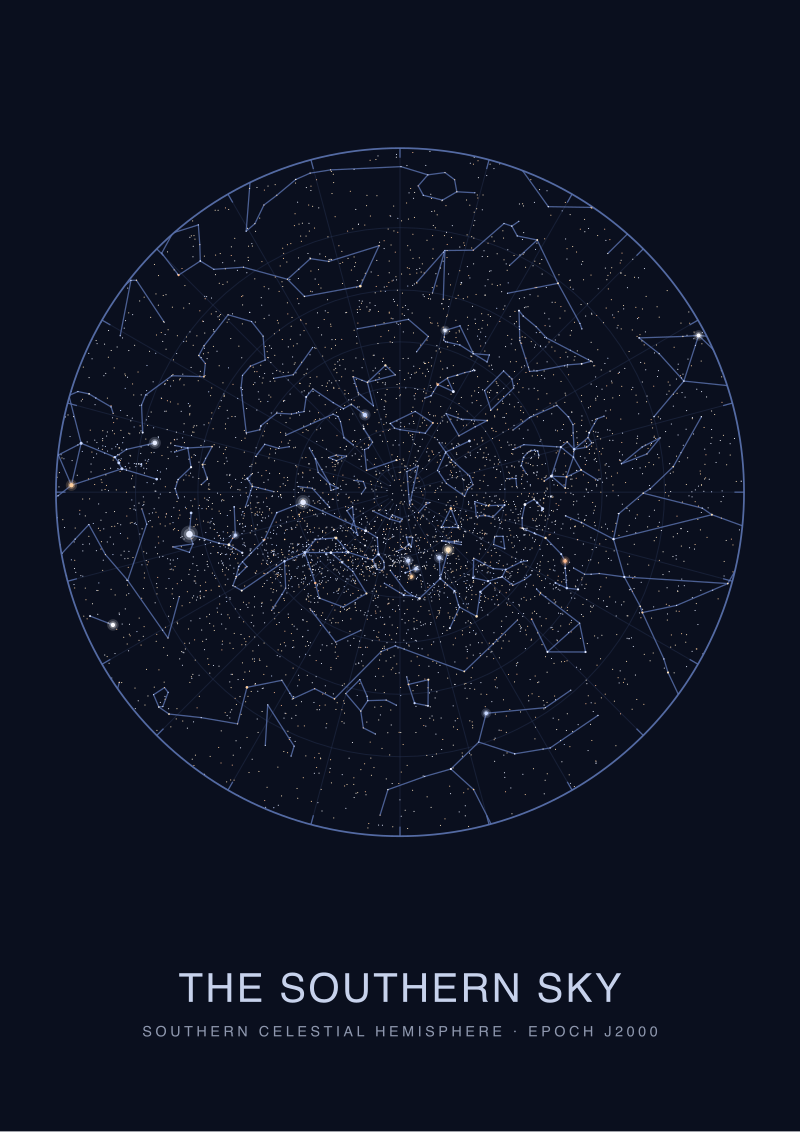 The Southern Sky
The print from this article · from €29.95
View the print →
The Southern Sky
The print from this article · from €29.95
View the print →
So What Do You Actually Do
The practical rule for anyone learning to read the night sky is to reverse the folk instinct on the first evening and be done with it. Blue-white is hot. Orange is cool. Sirius at 9,900 K and Arcturus at 4,300 K bracket everything a naked eye will meet on a dark night. Once that inversion is internalized, star color becomes a diagnostic tool: a quick temperature reading you can take with your own eyes.
If you use a sky app, check what it is actually giving you. Magnitude and spectral class are physics. Right ascension and declination are geometry. Anything that overlays those numbers with personality claims, frequencies, birth-chart influence, or wellness prescriptions has crossed from astronomy into invention, and the presence of accurate catalogue data on the same screen is not evidence that the overlay is real. If you already spent money on such an app, cancel the subscription and keep the star names. The names are useful. The framework built around them is not.
None of this tells you why no naked-eye star ever looks green — why the human retina refuses to register the wavelength at which most sun-like stars actually peak, and why the color chart of the sky is missing the middle of its own visible spectrum. That question sits inside human vision, not stellar physics, and it is where the next essay on this desk begins.
FAQ
What actually causes a star to appear blue, white, yellow, or orange?
The dominant cause is surface temperature. Stars radiate a continuous spectrum whose peak wavelength shifts as temperature changes: hot surfaces near 10,000 K peak in blue-white wavelengths, sun-like surfaces near 5,800 K peak in yellow-green but read as white to the eye, and cooler surfaces near 4,000 K peak in orange-red. Composition and luminosity class add fine detail, but the first-order color is set almost entirely by the temperature of the visible layer.
Why does Sirius look blue-white while Arcturus looks orange?
Sirius, magnitude −1.44 in Canis Major, has a surface temperature near 9,900 K and sits in the blue-white part of the stellar color scale. Arcturus, magnitude −0.05 in Boötes, is a cooler star at roughly 4,300 K and sits in the orange band. The temperature difference is more than 5,000 K, which is enough to shift the peak of each star's emitted light across the visible spectrum. The color you see is the physical consequence of that gap.
Is the temperature of a star the same as its brightness in the sky?
No. Apparent brightness — measured in magnitudes, where Sirius at −1.44 outshines Capella at 0.08 — depends on the star's true luminosity and its distance from Earth. Temperature is a separate property, tied to the color of the surface. Canopus at magnitude −0.62 is far more luminous than Sirius intrinsically, but it appears dimmer because it is much farther away. Brightness tells you what reaches your eye; color tells you how hot the surface is.
Why do most stars look white to the naked eye?
Human color vision requires enough light to activate cone cells in the retina, and most stars simply do not deliver that much light. Below roughly magnitude two, color perception collapses and the star reads white or grey. Only the brightest handful — including the six on this article's list — provide enough photons for the cones to register their true color. This is a limit of the human eye, not of the star, and it is why naked-eye color impressions cluster around a small set of well-known landmarks.
Do astrology apps use real astronomical data when they claim a star's color reveals personality?
Many of them pull real magnitude, coordinate, and spectral-class data from public catalogues such as HYG, then overlay personality claims that have no physical basis. The catalogue data is accurate; the interpretation is invented. The presence of correct astronomical numbers on the same screen is not evidence that the personality framework is grounded in astronomy. The zodiac itself is a coordinate band used by ancient observers to track the Sun's path, not a system for describing human character.
Why isn't there a green star in the night sky?
The Sun's spectrum actually peaks near green wavelengths, but the human eye integrates the full spectrum rather than isolating the peak, and a star radiating strongly across green also radiates strongly across red and blue. The mixture reads as white. For a star to look green, it would need to emit almost exclusively in green wavelengths, which no thermal blackbody spectrum ever does. Green is missing from the sky because of how vision samples color, not because green stars fail to exist.
Can I tell a star's temperature by eye, accurately enough to be useful?
For the brightest stars, yes. Sirius and Vega read blue-white and sit near 9,000 to 10,000 K. Canopus reads yellow-white and sits in the 7,000 K neighborhood. Rigil Kentaurus and Capella read warm-white to yellow and sit near or below solar temperatures. Arcturus reads orange and sits near 4,300 K. That is enough resolution to order the brightest stars by temperature without instruments, provided you are under a dark sky and the star is not close to the horizon.
Where should I look to learn star colors without an app trying to sell me meaning?
The most reliable path is a printed star atlas or an unadorned planisphere, paired with an honest chart of spectral class by star. Skip anything that adds personality, frequency, or energy overlays to catalogue data. The Sky Atlas shop at /shop/ prints maps that stop where the physics stops; other reputable astronomy publishers do the same. The rule of thumb is that a good star map answers the question "what is up there" and leaves the question "what does it mean for me" untouched.
From the collection
New charts and 10% off your first print.
One email now with your code. No noise after.